Analysis of Farming Fatalities: Trends and Insights 2012-2021
This in-depth analysis delves into farming fatalities data from 2012 to 2021, highlighting the causes, demographics, and patterns of such tragedies. The content provides a comprehensive overview of fatalities on farms, including fatalities involving vehicles, livestock, falls, machinery, and heavy loads. Detailed breakdowns and percentages offer valuable insights into the risks and occurrences associated with farming activities over the years.

Download Presentation

Please find below an Image/Link to download the presentation.
The content on the website is provided AS IS for your information and personal use only. It may not be sold, licensed, or shared on other websites without obtaining consent from the author. Download presentation by click this link. If you encounter any issues during the download, it is possible that the publisher has removed the file from their server.
E N D
Presentation Transcript
Farming Fatalities Updated 03/02/2022
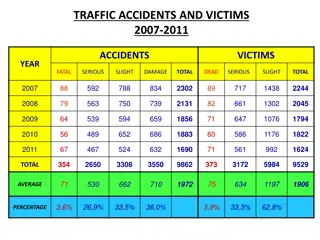
Farming Fatalities 2021 County Age Group Cavan Limerick Donegal Cork Mayo Sligo Tipperary Total 3 2 1 1 1 1 1 0-17 18-24 35-44 45-54 55-64 >65 Total 1 0 3 1 0 5 10 10 Trigger Employment Status Vehicle Livestock Load Machinery Fall Other Total 3 3 1 1 1 1 Employed 1 Family worker 2 Self-employed 7 10 Total 10
10 Year Breakdown Farming Fatalities 2012-2021
Farming Fatalities 2012 - 2021 9, 5% 13, 7% 14, 7% Vehicle Cattle Fall 87, 44% 16, 8% Machinery Load Drowning 20, 10% Other Total: 197 38, 19%
Vehicle Fatalities on Farms 2012 - 2021 8, 9% 4, 4% 5, 6% Tractor Loader/telehandler Quad 11, 13% Trailer Excavator 48, 55% Other 11, 13% Total: 87
Livestock Fatalities on Farms 2012 - 2021 4, 10% 12, 32% 6, 16% Attacked by cow with calves Knocked over by cattle Attacked by bull Attacked by cattle Other 7, 18% 9, 24% Total: 38
Fatalities from Falls on Farms 2012 - 2021 3, 15% 6, 30% Fall through roof Fall from ladder/roof 3, 15% Fall from vehicle Slip, trapped between bales Other 3, 15% Total: 20 5, 25%
Machinery Fatalities on Farms 2012 - 2021 2, 13% 5, 31% 2, 12% Crushed Trapped Struck Struck by Falling Object Slip 3, 19% Total: 16 4, 25%
Fatalities involving heavy loads on Farms 2012 - 2021 3, 22% Heavy load falls on victim Silage bale rolls down hill 1, 7% Struck while moving heavy load Vehicle crushes victim doing maintenance 1, 7% 9, 64% Total: 14
Drowning Fatalities on Farms 2012 - 2021 2, 15.5% Other 6, 46% Other Tank 2, 15.5% Slurry/silage pit Slurry tank 3, 23% Total: 13