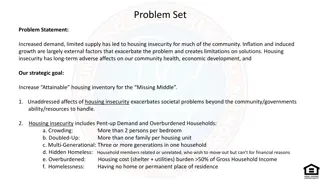
Insights into Food Insecurity in Scotland from the Scottish Health Survey
The Scottish Health Survey provides valuable insights into food insecurity in Scotland, highlighting statistics on poverty, destitution, and food aid distribution. Efforts to measure household food insecurity systematically are discussed, with a focus on promoting awareness and addressing the issue effectively.

Download Presentation

Please find below an Image/Link to download the presentation.
The content on the website is provided AS IS for your information and personal use only. It may not be sold, licensed, or shared on other websites without obtaining consent from the author. Download presentation by click this link. If you encounter any issues during the download, it is possible that the publisher has removed the file from their server.
E N D
Presentation Transcript
Food Insecurity in Scotland: Insights from the Scottish Health Survey Catriona Rooke Senior Researcher Communities Analysis Division
Background Trussell Trust report steep rises in food bank use over the last 5 years; however, a minority of those experiencing food insecurity use food aid In 2016 the Independent Working Group on Food Poverty recommended measuring household food insecurity systematically Agreed questions on food insecurity would be included in the Scottish Health Survey Current End Hunger UK campaign to routinely measure food insecurity in the UK
What do we know? 19% of all people in Scotland - 24% of children - were living in relative poverty AHC in 2014-17 JRF estimated that 1.55 million people were destitute at some point during 2017 in the UK Trussell Trust report that from April 2017 - March 2018, the network gave out 170,625 3-day emergency food supplies A 2014 UN survey found 10% of people in the UK were moderately food insecure
The Scottish Health Survey Designed to give a representative sample of the general population living in private households - clustered, stratified multi-stage sample design Principal focus is cardiovascular disease and related risk factors In 2017, 3,697 adults and 1,603 children took part in the survey Interviews conducted using combination of Computer Assisted Interviewing and self- completed paper questionnaires.
3 questions from the FIES During the last 12 months, was there a time when: 1) You were worried you would run out of food because of a lack of money or other resources? you were unable to eat healthy and nutritious food because of a lack of money or other resources? you ate only a few kinds of foods because of a lack of money or other resources? you had to skip a meal because there was not enough money or other resources to get food? You ate less that you thought you should because of a lack of money or other resources? Your household ran out of food because of lack of money of other resources you were hungry but did not eat because there was not enough money or other resources for food? you went without eating for a whole day because of a lack of money or other resources? 2) 3) 4) 5) 6) 7) 8)
The set of eight questions compose a scale that covers a range of severity of food insecurity: UN FAO: http://www.fao.org/in-action/voices-of-the-hungry/fies/en/ 1) You were worried you would run out of food because of a lack of money or other resources? 5) You ate less that you thought you should because of a lack of money or other resources? 6) Your household ran out of food because of lack of money of other resources
Food insecurity in Scotland 2017 8% of adults said that they were worried they would run out of food due to a lack of money or resources 7% said they ate less than they should due to lack of money or other resources 4% said they had run out of food due to lack of money or resources N.B. The estimates for prevalence of people eating less than they should/running out of food are population estimates; however as the questions were only asked of those that were worried about running out of food this may slightly underestimate prevalence Scottish Government (2018) Scottish Health Survey 2017: Volume 1: Main Report: https://www.gov.scot/Publications/2018/09/9247
Worrying about running out of food was significantly associated with age Age 16-34 45-64 65+ Total Food insecurity Men Worried Ate less Ran out 6 5 4 1 0 0 8 7 4 13 11 6 Women Worried Ate less Ran out 7 6 4 1 1 1 8 7 4 13 10 6
Single adult households were more likely to be food insecure Hhold Type Older smaller family Single parent Single family Large family Single older Single adult Large adult Small adult Food insecurity Worried 2 8 1 6 9 11 20 21 Ate less Ran out 2 1 7 4 1 0 4 2 8 10 4 18 18 14 10 5
There was a relationship between food insecurity & area deprivation Food insecurity by area deprivation 20% 18% 16% 14% 12% 10% 8% 6% 4% 2% 0% Worried Ate less Ran out 5th (Least deprived) 4th 3rd 2md 1st (Most deprived)
What data are available in the UK? Family Resources Survey Scottish Index of Multiple Deprivation Deprivation Scottish Index of Multiple Scottish Health Survey National Diet & Nutrition Survey Labour Force Survey Some Scottish data in the SHeS Food Foundation, Household food insecurity: the missing data, 2016
How does this fit with other indicators? UK data (2014): 10% of people moderately food insecure (UK - UN); 13% of households marginally food insecure, 8% severely food insecure (England, Wales, NI - FSA) GoWell survey (2016): 4% of respondents in deprived areas of Glasgow had used a food bank; 18% reported having difficulty paying for food Affordability of healthy food (2018): 24% of households in Scotland would need to spend more than a quarter of their disposable income to meet the Eatwell Guide
How does this fit with what we know about who is at risk? GoWell survey (2016) found the highest rate of food bank use among single adults and single parents; being male, younger than 40 and not working increased odds of use Survey of Trussell Trust food bank users (2017) found lone parent householdsconstitute the largest number of people receiving help, though single male households are the most common household type CAS (2016) found clients needing advice about food parcels were younger, more likely to be male and the majority were single adults Food and You survey (2016) found women, younger people and households in the lowest income quartile more likely to live in food insecure households.
Next steps Same questions included in the SHeS in 2018 and 2019 (local breakdowns) SDG 2 is to End Hunger: measure of this included in the NPF (based on this data), linked to poverty & human rights outcomes A full module of questions on food insecurity Additional analysis of 2017 data demographic characteristics/health outcomes
Thank you for listening Any questions/clarifications? Some questions to consider: How do you think you/your organisation will use this information? How does it fit with your current understandings? What additional analysis of this data do you think would be useful to you/your organisation?