Understanding Experiences of Women of Color Faculty in STEM Academia
Women of color face unique challenges in STEM academia due to the intersectionality of gender and race, impacting their workplace perceptions. This paper explores the experiences of underrepresented women of color in academia, comparing them with their STEM colleagues in terms of stress sources, workload demands, and satisfaction levels. Data from the HERI Faculty Survey sheds light on the experiences of women of color faculty in STEM fields, highlighting issues such as stress factors and subtle discrimination.
Download Presentation

Please find below an Image/Link to download the presentation.
The content on the website is provided AS IS for your information and personal use only. It may not be sold, licensed, or shared on other websites without obtaining consent from the author. Download presentation by click this link. If you encounter any issues during the download, it is possible that the publisher has removed the file from their server.
E N D
Presentation Transcript
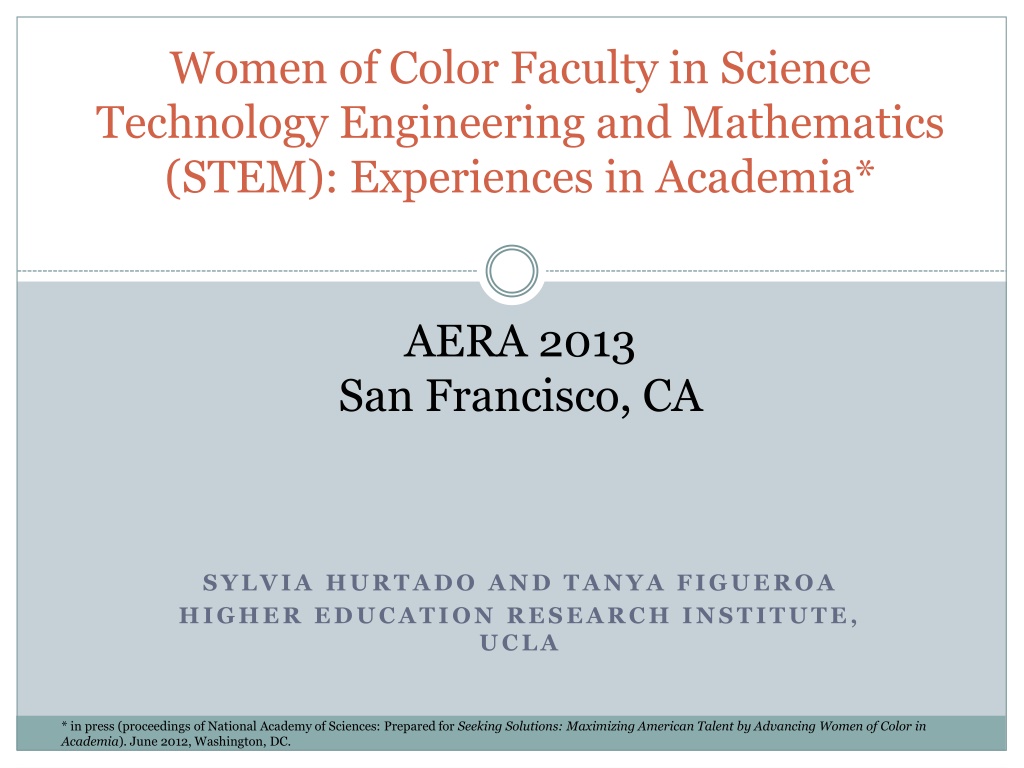
Women of Color Faculty in Science Technology Engineering and Mathematics (STEM): Experiences in Academia* AERA 2013 San Francisco, CA SYLVIA HURTADO AND TANYA FIGUEROA HIGHER EDUCATION RESEARCH INSTITUTE, UCLA * in press (proceedings of National Academy of Sciences: Prepared for Seeking Solutions: Maximizing American Talent by Advancing Women of Color in Academia).June 2012, Washington, DC.
A Word about Intersectionality Women of color face a double bind for having two identities that are especially undervalued in STEM contexts The intersection of both gender and race is reflected in women of color s unique perceptions of the workplace in academia The purpose of this paper is to explore the experiences of underrepresented women of color in academia. We compare URM women with STEM colleagues in terms of sources of stress, workload demands, and satisfaction.
Data Source HERI Faculty Survey, administered triennially 2010 Individual institutional administration 2010 STEM Supplement-NSF sponsored 2007 98 Institutions added to augment sample Sample: 673 four-year colleges and universities 11, 039 STEM faculty (unweighted) 272 Women of Color in STEM 2013 Faculty Survey: www.heri.ucla.edu
Sample: Rank, Race and Gender in STEM Lecturer/ Instructor Sample URM Women 272 (2.5%) Asian Women 258 (2.3%) White Women 3,857 (34.9%) URM Men 374 (3.4%) Asian Men 565 (5.1%) White Men 5,713 (51.8%) Professor Associate Assistant 16.2% 24.6% 31.3% 23.5% 18.6% 29.5% 30.2% 15.1% 22.5% 28.8% 29.6% 14.4% 28.6% 27.8% 21.9% 16.3% 30.8% 24.1% 28.8% 6.5% 41.8% 26.3% 17.8% 8.6%
Top 10 Sources of Stress Comparisons White Males URM Females Lower on: Lack of personal time Self-imposed high expectations Managing household duties Institutional red tape (Higher) White Females Students (Higher) URM Males Lower on: Lack of personal time Managing household duties 86.4 Lack of personal time 82.4 Self-imposed high expectations 79.0 Managing household duties 69.9 Working w underprepared students 66.0 Institutional budget cuts 65.8 Personal finances 61.8 Research or publishing demands 61.0 Institutional 'red tape' 61.0 Teaching load 58.5 Students
Source of Stress in the Last Two Years: Subtle Discrimination (e.g., prejudice, racism, sexism) % Responding "Somewhat" or "Extensive" 45 40 42.7 40.3 35 30 25 28.5 ** 27.1** 20 24.6 ** 15 10 10.5** 5 0 White ** URM** Asian* STEM Males STEM Females Note: Significant male/female differences within group** p=<.01; * < .05.
Average Career-Related Stress 60 55 50 45 40 35 30 Professor Associate Professor Assistant Professor Lecturer or Instructor Rank White Male URM Female White Female Asian American Male URM Male Asian American Female
Workloads for STEM Tenure Track Faculty (5+ hrs/wk on respective task) Advising Counseling Students White URM Asian Male 38.5* 42.7 43.2 Female Committee Work or Meetings 43.6 48.5 44.3 Male 36.1** 38.6 32.3** Female 43.8 48.5 40.8 Research and Scholarly Writing Male 59.8* 66.2** 73.3* Female 44.9 49.5 60.2 Note: Significant differences with URM females, **= p<.01; *=p<.05.
Work Environment My Research is Valued by Faculty in My Department White URM Asian Male 79.3** 77.0 83.3** Female I Have to Work Harder Than My Colleagues to be Perceived as a Legitimate Scholar 72.7 69.7 77.6 Male 52.4** 60.1** 74 Female Note: Significant comparisons with URM females; **=p <.01; *=p<.05. 66.6* 79.1 80.9
Mean Faculty Satisfaction with Compensation and Work 54 52 50 48 46 44 42 Professor Associate Professor Assistant Professor Rank Lecturer or Instructor White Male URM Female White Female Asian American Male URM Male Asian American Female
Conclusion and Implications URM women share many of the same experiences as other women in STEM but also have unique sources of stress, as well as lower satisfaction and respect. Salary equity studies, professional development support & dept. support for advancement. Assessment challenge: Severe underrepresentation makes the data difficult to collect because of their vulnerablity/identification. How to use information to change dept. climate, navigating political issues.
