Insights into School Segregation 70 Years After Brown
Explore the state of segregation in schools 70 years after Brown v. Board of Education through insightful analyses covering topics such as measuring segregation, historical changes post-Brown, recent trends in racial and economic segregation, impact on educational opportunities, and more.

Download Presentation

Please find below an Image/Link to download the presentation.
The content on the website is provided AS IS for your information and personal use only. It may not be sold, licensed, or shared on other websites without obtaining consent from the author. Download presentation by click this link. If you encounter any issues during the download, it is possible that the publisher has removed the file from their server.
E N D
Presentation Transcript
The state of segregation: 70 years after Brown Ann Owens, University of Southern California Sean Reardon, Stanford University May 6, 2024
10 Insights into School Segregation 1. Measuring school segregation 2. How did Brown v. Board of Education change school segregation? 3. How has racial/ethnic school segregation changed recently? 4. Has school segregation returned to pre-Brown levels? 5. How has economic school segregation changed recently? 6. What role do school district boundaries play in school segregation? 7. Where is segregation high? 8. How do non-school factors shape recent trends in school segregation? 9. How do educational policies shape recent trends in school segregation? 10. How does school segregation affect educational opportunities?
1. Measuring school segregation The normalized exposure index compares the compositions of schools attended by students of different racial/ethnic or economic groups. Also known as the variance ratio index, the relative variation index, or eta2. Highly correlated with other standard measures of segregation (dissimilarity index, information theory index) but readily interpretable and has better mathematical properties
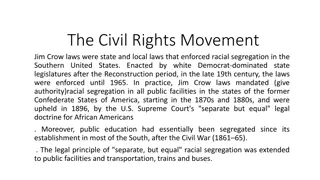
2. How did Brown v. Board of Education change school segregation? Brown v. Board declared separate schooling systems unequal and unconstitutional. It paved the way for future decisions that led to affirmative desegregation of schools within districts. However, school segregation in the South did not change much in many places until the 1968 Green v New Kent County decision.
3. How has racial/ethnic school segregation changed recently? School segregation has increased by 37% since 1991 in large districts. The increase is large in relative terms but modest compared to the declines in segregation prior to 1973 Segregation is very high in some large districts
White-Black segregation grew by 37% from 1991-2019
4. Has school segregation returned to pre- Brown levels? No. Segregation levels are high, troubling, and rising in large districts, but they are not at pre-Brown levels. Some scholars have noted that the proportion of students in predominantly minority (Black/Hispanic/Native) schools has risen sharply and is higher than it was in the late 1960s. But this is mostly (but not entirely) due to changing student demographics. As the school population has become less White, all students attend school with fewer White students than in the past.
5. How has economic school segregation changed since 1991? Segregation between students eligible and ineligible for free lunch has increased in large districts since 1991. Most of that increase is in the last 15 years. Racial-economic segregation the racial/ethnic difference in exposure to school poverty has also increased. We don t have data prior to 1991 on economic segregation.
Economic school segregation grew by 52% from 1991-2019
Black-White economic school segregation grew by 70% from 1991-2019
Hispanic-White economic school segregation grew by 68% from 1991-2019
6. What role do school district boundaries play in school segregation? The analyses above focus on segregation among schools in the same district. But most school segregation in metropolitan areas occurs between districts, rather than between schools within the same district.
In the Detroit metropolitan area, between-district segregation is very high, and accounts for 97% of total metropolitan area segregation In the Charlotte metropolitan area, between-district segregation is much lower, and accounts for 47% of total metropolitan area segregation
On average, between-district segregation accounts for about 60% of total metropolitan area segregation
Between-district segregation has been increasing since 1991
7. Where is segregation high? Generally, school segregation is higher in places with: higher residential segregation higher racial/ethnic socioeconomic inequality larger enrollments and more schools
8. How do non-school factors shape recent trends in school segregation? Although segregation is higher in more segregation and economically unequal places, both residential segregation and racial socioeconomic inequality have been declining in large districts over the last 30 years. In most districts, school segregation has increased while residential segregation and inequality have declined. The rise in school segregation is not due to changes in racial/ethnic residentialsegregation and racial/ethnic socioeconomic inequality.
In 1991, schools were much more integrated than neighborhoods: the average black-white neighborhood segregation was 0.36; the average school segregation was 0.20.
In 1991, schools were much more integrated than neighborhoods: the average black-white neighborhood segregation was 0.36; the average school segregation was 0.20.
In 1991, schools were much more integrated than neighborhoods: the average black-white neighborhood segregation was 0.36; the average school segregation was 0.20.
By 2019, average neighborhood segregation had declined to 0.28; while school segregation grew to 0.26. Schools increasingly mirror their neighborhoods In 1991, schools were much more integrated than neighborhoods: the average black-white neighborhood segregation was 0.36; the average school segregation was 0.20.