Weekly COVID-19 Wastewater Levels & Trends - Monitoring and Analysis Report
Monitoring wastewater for SARS-CoV-2 virus levels provides crucial insights into COVID-19 spread and trend tracking in the community. The latest report for the week of October 16-22, 2022, shows moderate virus levels in wastewater with steady, decreasing, and increasing trends across different sites. Recommendations include staying updated on vaccines, practicing preventive measures, and monitoring data continuously. For more details, view the infographic guides provided in the content.

Download Presentation

Please find below an Image/Link to download the presentation.
The content on the website is provided AS IS for your information and personal use only. It may not be sold, licensed, or shared on other websites without obtaining consent from the author. Download presentation by click this link. If you encounter any issues during the download, it is possible that the publisher has removed the file from their server.
E N D
Presentation Transcript
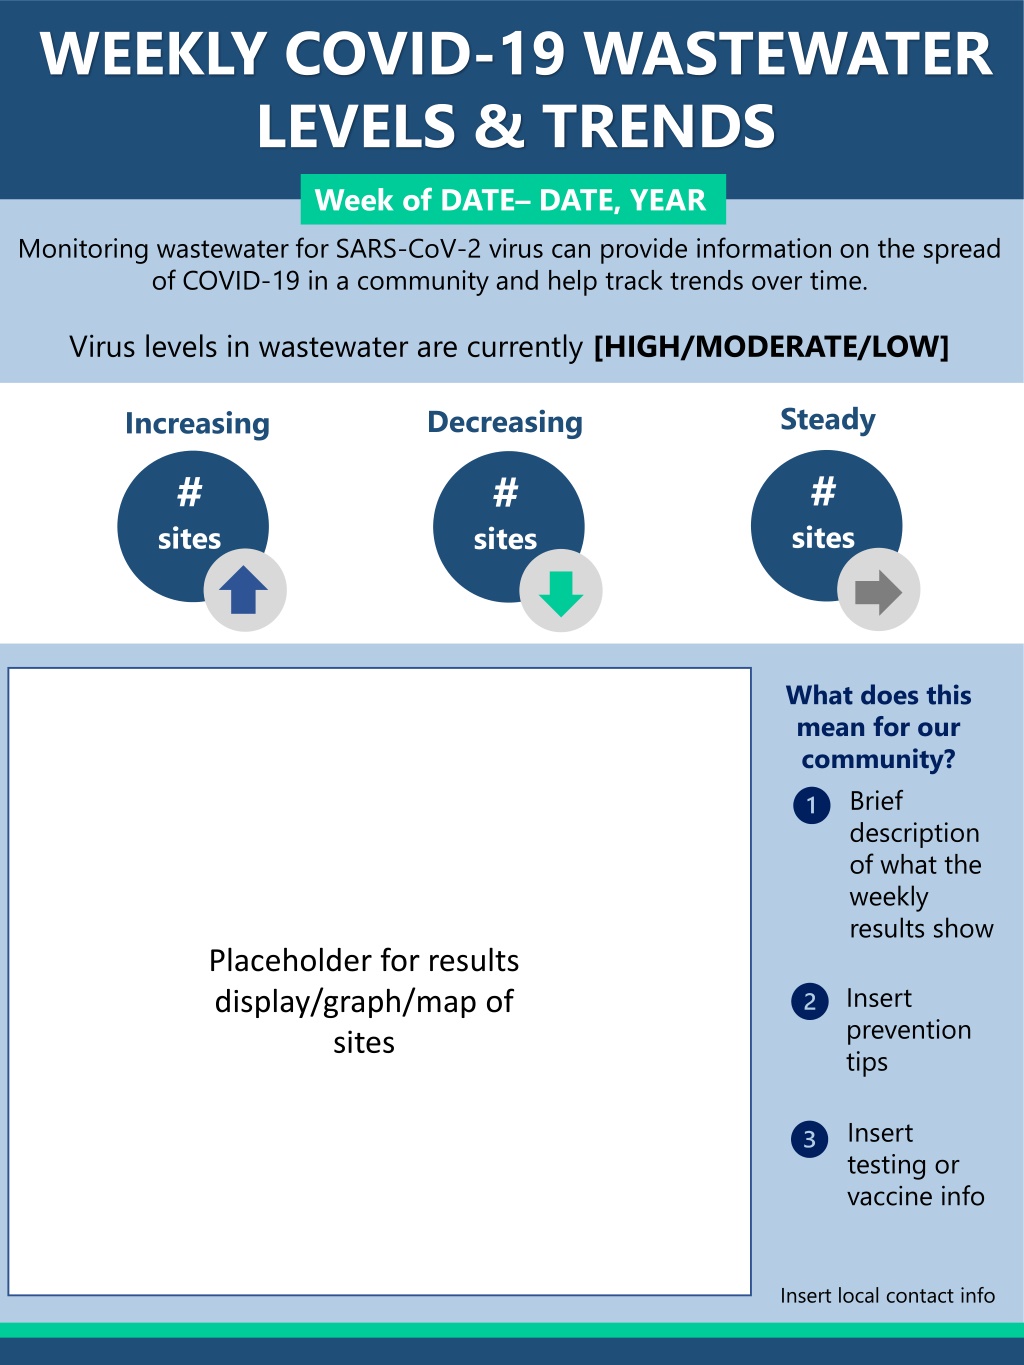
WEEKLY COVID-19 WASTEWATER LEVELS & TRENDS Week of DATE DATE, YEAR Monitoring wastewater for SARS-CoV-2 virus can provide information on the spread of COVID-19 in a community and help track trends over time. Virus levels in wastewater are currently [HIGH/MODERATE/LOW] Steady # sites Decreasing # sites Increasing # sites What does this mean for our community? Brief description of what the weekly results show Placeholder for results display/graph/map of sites Insert prevention tips Insert testing or vaccine info Insert local contact info
WEEKLY COVID-19 WASTEWATER LEVELS & TRENDS Week of DATE DATE, YEAR Virus levels in wastewater are currently [HIGH/MODERATE/LOW] Steady # sites Decreasing # sites Increasing # sites Placeholder for results display/graph/map of sites What does this mean for our community? Brief description of what the weekly results show and/or insert prevention tips/testing/vaccine info, etc.
Results Distribution Infographic Guide Data Display Ideas The purpose of this infographic is to provide local projects with templates for sharing local SARS- CoV-2 wastewater data with partners and/or the community. Due to differences in how agencies present data, there are some ideas included in this document, but the templates can be altered by your agency to display the data in a way that works best for your targeted audience. Idea 2 Idea 1 A heat map, which could highlight the most recent week of data. A table of wastewater sites with an arrow indicating recent trends (increasing, decreasing, plateauing). Weekly Trends by Site Site Name 1 Site Name 2 Site Name 3 Site Name 4 Site Name 5 Site Name 6 Idea 3 Idea 4 Map with sites marked or sewershed boundaries shown. Could use colored arrows to indicate weekly trends. Highlight one or two bigger community sites, could include graph of virus levels in wastewater and overlay clinical cases.
WEEKLY COVID-19 WASTEWATER LEVELS & TRENDS Week of October 16-22, 2022 Monitoring wastewater for SARS-CoV-2 virus can provide information on the spread of COVID-19 in a community and help track trends over time. Virus levels in wastewater are currently MODERATE Steady 5 sites Decreasing 8 sites Increasing 7 sites What does this mean for our community? Michigan SWEEP sites Data as of 10/26/2022 Results for the week show a mix of trends. Data will continue being monitored in addition to clinical data. It s important to stay up to date on COVID-19 vaccines and boosters. Learn more at Michigan.gov/COVIDvaccine. Residents should prevent the spread of illness by staying home when sick, covering coughs and sneezes, and washing hands regularly. Questions? Contact us at MDHHS- SEWERNetwork@michigan.gov