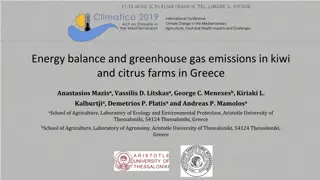
Analysis of Greenhouse Gas Emissions in Air Transport by Gregg Patrick
Detailed overview of Gregg Patrick's analysis on greenhouse gas emissions in air transport, covering project timeline, methodological issues, preliminary results from 2005-2010, key problems with data, and ad hoc solutions implemented.

Download Presentation

Please find below an Image/Link to download the presentation.
The content on the website is provided AS IS for your information and personal use only. It may not be sold, licensed, or shared on other websites without obtaining consent from the author. Download presentation by click this link. If you encounter any issues during the download, it is possible that the publisher has removed the file from their server.
E N D
Presentation Transcript
Analysis of GHG Emissions in air transport by Gregg Patrick
Overview Timeline to project Work done to date Some methodological issues Preliminary results for GHG emissions, 2005- 2010 Further developments
Timeline Sep 2009 Project initiation (phase 1) Nov 2009 Presentation of method at Business Statistics Seminar, Dublin Nov 2010 Joint discussion with Eurostat Feb 2011 Project restarted (phase 2) May 2011 Preliminary results available
Work Done (Phase 1) Origin Destination Passengers Country of Residence Origin Destination Aircraft Type Aviation Transport A1 Dataset Source: CSO Passengers Flights Country of Residence Source: CSO Aircraft Fuel Burn Source: EMEP /EEA Great Circle Distance Source: GCM Irish Airport (Lat/Long) Foreign Airport (Lat/Long) Great Circle Distance Aircraft Type Fuel burn /Distance GHG emissions
Work Done (Phase 2) Year Month Origin Departure Aircraft Type Flights Passengers Freight & Mail Seats Year Month Day Origin Departure Mean Distance Aviation Transport A1 Dataset Source: CSO Eurocontrol Dataset Aircraft Fuel Burn Source: EMEP/EEA Aircraft Type Fuel Burn/Distance GHG emissions
Key problems with EMEP/EAA data 1. Only 19 jet aircraft types represented Many modern jet types missing (e.g. Boeing 737-800) No small executive jets (e.g. Learjet) 2. Only 25 turboprop aircraft types represent Only one small turboprop (Cessna 208 Caravan)
Ad hoc solution - Concordance Actual Aircraft Type EMEP/EEA generic Aircraft Type Code Description Code Description A319 A320 A321 Airbus A319 Airbus A320 Airbus A321 etc.... n.a. A320 n.a. n.a. Airbus A320 n.a. etc...
Preliminary Results 2005-2010 Patrick Foley
Flights departing main Irish airports in 2010: 104,400 Shannon 6% Kerry 2% Knock 3% Galway 3% Cork 11% Dublin 75%
Flights departing main Irish airports, 2005- 2010 160 140 Flights (thousands) 120 Cork Galway Dublin Knock Kerry Shannon Total 100 80 60 40 20 0 2005 2006 2007 2008 2009 2010 Year
Flights departing main Irish airports by aircraft type, 2010 Airbus A320 26% Other(*) 23% Airbus A321* 5% ATR 42-200 5% ATR 72 7% Boeing 737- 800* 34%
Fuel burn of aircraft types departing main Irish airports, 2005-2010 900 Fuel (thousand tonnes) 800 700 Airbus A320 Airbus A321* ATR 42-200 ATR 72 Boeing 737-800* Other (*) Total 600 500 400 300 200 100 0 2005 2006 2007 2008 2009 2010 Year
CO2 emissions from flights departing main Irish airports, 2005-2010 3,000 CO2 (thousand tonnes) 2,500 Airbus A320 Airbus A321* ATR 42-200 ATR 72 Boeing 737-800* Other (*) Total 2,000 1,500 1,000 500 - 2005 2006 2007 2008 2009 2010 Year
Monthly CO2 emissions (thousand tonnes) from flights leaving main Irish airports, 2005- 2010 2010 2009 2008 2007 2006 2005 250 200 150 100 50 0 Jan Feb Mar Apr May Jun Jul Aug Sep Oct Nov Dec
CO2 emissions from flights departing Dublin airport by destination airport, 2005- 2010 1. London - Heathrow 140 CO2 (thousand tonnes) 120 2. Paris - Charles de Gaulle 100 3. London - Gatwick 80 60 4. London - Stanstead 40 8. Amsterdam 20 0 9. Malaga 2005 2006 2007 2008 2009 2010 Year 10. New York - JKF
Mean CO2 emissions per passenger from flights departing Dublin airport by destination airport, 2005-2010 600 1. London - Heathrow 500 2. Paris - Charles de Gaulle 400 CO2 (kg) 300 3. London - Gatwick 200 4. London - Stanstead 100 8. Amsterdam 0 2005 2006 2007 2008 2009 2010 9. Malaga Year 10. New York - JFK
Conclusions from experience to date: Wealth of information to be attained (Aircraft kms, passenger kms, tonne-kms, CO2, NOx, HC, CO, CO2 per passenger, CO2 per tonne of freight, by airport, route, aircraft type, etc.) Process relatively straightforward Use of Eurocontrol data adds refinement Only significant problem is the limitation of the EMEP/EEA datasets
Further developments Jul 2011 Investigation of Eurocontrol Small Emitters Tool Aug 2011 Presentation of paper at ITRN conference Dec 2012(?) Dissemination of results on CSO StatBank service


")
")
")


")