Understanding Nutrient Cycling in Soil for Sustainable Agriculture
Explore the intricate processes of nutrient cycling in soil, with a focus on nitrogen (N) and phosphorus (P) balances. Discover the various inputs and outputs considered within different scales, from field to country level. Gain insights into the importance of interpreting data correctly and the impact on agronomic efficiency and environmental sustainability. Delve into the specific balances of N and P in arable land in Estonia, and learn about methodologies used in Europe to assess soil nutrient balances.

Download Presentation

Please find below an Image/Link to download the presentation.
The content on the website is provided AS IS for your information and personal use only. It may not be sold, licensed, or shared on other websites without obtaining consent from the author. Download presentation by click this link. If you encounter any issues during the download, it is possible that the publisher has removed the file from their server.
E N D
Presentation Transcript
Nutrient cycling in soil focus on N (and P) balances Alar Astover 16 February 2016
Plant nutrient balances Scale and methods can vary Scale (system boundary): field-farm-catchment- county-country What inputs and outputs are considered Losses accounted or not (typically not) Appropriate interpretation is important Indirective indicator of agronomic efficiency and environmental pressure Single year results can be misleading Surplus leaching 16 February 2016 - A. Astover 2
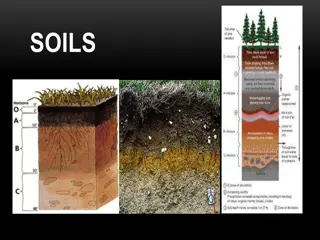
Nutrient cycling Atmospheric deposition Photosynthesis CO2 Microbial N fixation CO2, N2O, N2 .. Mineral fertilizers Runoff/erosion Cation exchange with colloids NO3-, NH4+, PO4-3, HPO4-2, K+etc Organic matter Soil biota Nurients in soil solution Weathering of minerals/rocks Mineralisation im (P, K etc) Humification Leaching 16 February 2016 - A. Astover 3
N soil surface balance of arable land in Estonia Removed with crops Precipitation Seeds Microbial fixation Manure Mineral fertilizers 16 February 2016 - A. Astover 4
P soil surface balance of arable land in Estonia Soil P concentration Removed with crops Seeds Lime fertilizers Manure Mineral fertilizers 16 February 2016 - A. Astover 5
N, P soil surface balance in Estonia OECD/EU methodology. Estonian Statistical Office 16 February 2016 - A. Astover 6
N balance in Europe (agricultural land) 16 February 2016 - A. Astover 7
NO3- concentration in drainage water in diferent farming systems S rekannno ja Kanger 2015 16 February 2016 - A. Astover 8
NO3- concentration in drainage water in farms with environmental friendly production S rekannno ja Kanger 2015 16 February 2016 - A. Astover 9
NO3- concentration in drainage water in farms with conventional production S rekannno ja Kanger 2015 16 February 2016 - A. Astover 10
N, P leaching in different farming systems N, kg/ha P, kg/ha S rekannno ja Kanger 2015 16 February 2016 - A. Astover 11
Soil P level (CAL-method): A very low concentration (deficit) E very high concentration (surplus) Chicken farm in soviet time 16 February 2016 - A. Astover 12
Field experiment in 2015: spring barley Tartu, soil humus concentration 2% 16 February 2016 - A. Astover 16
Field experiment in 2015: spring barley 16 February 2016 - A. Astover 17
Example of spring barley: agronomic and economic optimum of mineral N fertilizer rate depending on soil humus concentration N, kg ha-1 140 Nagr = 165.48-40.98x+4.97x2-0.0217x4;R2= 0.95 120 Necon = 136.53-35.57x+4.10x2-0.0182x4;R2= 0.97 100 80 Nagr Necon 60 40 20 Humus content, % 0 1 2 3 4 5 6 7 8 9 10 Astover et al. 2006 H. Roostalu
Humus balance calculator (version 1.1) Field scale Takes in account Soil Fertilization Crop specifics, yield etc Mainly non-lineaar functions. Example of humus balance in case of spring barley (grain yield 3 t/ha) depending on N fertilization 16 February 2016 - A. Astover 19
Humus balance: effect of complex fertilizers, spring wheat kg/ha 2000 Mineralisation 1800 1600 1400 Humus formation (straw into soil) 1200 1000 800 600 400 200 kompleksv etist, kg/ha 0 -200 0 100 200 300 400 500 600 700 800 900 1000 -400 Balance(straw into soil) -600 -800 -1000 -1200 -1400 Huumust mineraliseerub Huumust tekib juurtest ja p hust Huumuse bilanss juurte ja p hu mulda viimisel Huumuse bilanss ilma p huta -1600 Balance(straw removed) 16 February 2016 - A. Astover 20
Example from pilot farm Humus balance in 2012 2014 Keskmine huumusevaru t/ha Humus stock Huumuse bilanss kg/ha/year Humus balance Huumuse kulu ldvarust, % Ratio to stock Viljavaheldus Crop rotation Pind, ha Area Raps-teravili-raps Rapeseed-cereal-rapeseed 53,54 96 -417 -0,47 Teravili-raps-teravili Cereal-rapeseed-cereal 336,03 91 -520 -0,35 Hernes-teravili-raps Pea-cereal-rapeseed 123,81 98 -115 -0,11 Teravili-hernes-teravili Cereal-pea-cereal 150,65 84 -118 -0,12 Teravili-teravili-teravili Cereal-cereal-cereal 37,83 66 -599 -0,91 Kokku talu Total/Average 701,86 90 -359 -0,30 16 February 2016 - A. Astover 21
Soil of the Year 2016 in Estonia is Fibric Histosol (bog soil) Aasta muld 2016 - rabamuld Alar Astover, professor Estonian University of Life Sciences, Institute of Agricultural and Environmental Sciences, Department of Soil Science and Agrochemistry Estonian Soil Science Society E-mail: alar.astover@emu.ee 16 February 2016 - A. Astover 22


")


:")


")