Multidimensional Freight Resource Allocation & Project Prioritization Research
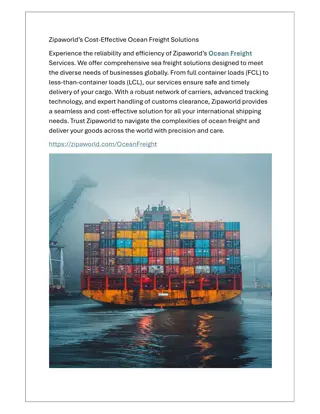
This research focuses on optimizing freight resource allocation and project prioritization to address congestion and mobility constraints. The study emphasizes identifying low-cost, high-rate-of-return, and quickly implementable solutions to enhance the freight transportation system. By leveraging various resource allocation models and dimensions, the objective is to maximize benefits while considering budgetary and policy constraints.

Download Presentation

Please find below an Image/Link to download the presentation.
The content on the website is provided AS IS for your information and personal use only. It may not be sold, licensed, or shared on other websites without obtaining consent from the author. Download presentation by click this link. If you encounter any issues during the download, it is possible that the publisher has removed the file from their server.
E N D
Presentation Transcript
Multidimensional freight resource allocation and optimal project prioritization Santosh Bhattarai Mihalis Golias Ahmadreza Talebian Sabyasachee Mishra Department of Civil Engineering and Intermodal Freight Transportation Institute University of Memphis Presentation at UF STRIDE Conference November 17, 2017
Research Motivation Freight demand is receiving ever-increasing attention Improvements to the freight transportation system are complicated and expensive Public and private agencies often try to find operational improvements that 1) are low-cost 2) have high rate-of-return 3) are quickly implementable (LHQ solutions) Forecasts for freight transportation demand Source: National Renewable Energy Laboratory 2
Research Motivation (contd) Key question: how to develop LHQ solutions to address freight congestion and mobility constraints Tennessee has heavy freight traffic Identifying LHQ solutions would provide significant value to public and private sectors in TN More projects and less budget leads to project prioritization problem Origins Destinations High-value and time-sensitive products, highway freight density in tons Source: FHWA Air-Freight Origins and Destinations (All commodities, in tons) Source: FHWA 3
Methodology (contd) Base model based on higher order of benefits (manual allocation) Four resource allocation models based on following policies: Economic competitiveness without mutually exclusiveness Economic competitiveness with mutually exclusiveness Equity in opportunity Equity in outcome 6
Methodology (contd) Six dimensions of the model include: transportation mode performance measures Improvement type geographical regions policy criteria planning periods Objective function is to maximize the benefit received subject to budget, policy, and other constraints 7
Methodology (contd) Model 1: Economic Competitiveness without mutually exclusiveness Standard resource allocation model As this model is subjected to budgetary constraints only, maximum objective function (total benefit) is expected 6
Methodology (contd) Model 2: Economic Competitiveness (II) Standard resource allocation model subjected to mutually exclusiveness constraint for each location A given location gets a maximum of one project Since one more constraint is added, the objective function is expected to reduce, compared to Model 1 7
Methodology (contd) Model 3: Equity in Opportunity Equity in opportunity ensures the equitable allocation of resources across multiple dimensions of the model Addition of equity constraints to Model 2 This model defines the pre-specified bounds for number of projects to each county This model has the lowest objective function of all models 8
Methodology (contd) Model 4: Equity in Outcome Although Model 3 allocates the equitable number of projects across all the counties, equitable distribution of economic and safety benefits is not assured To address this equitable benefit, equity constraints are added to Model 2 Compared to Model 2, this model is more constrained and hence expected to give lower objective function 9
Case Study: Model Application Region 2 Region 1 Region 3 Region 4 10
Case Study: Model Application (contd) 2238 projects are proposed in 51 counties The budget starting with 10 million dollars in the first year increases by 3% every successive year $95.78 million of present worth in 10 years planning period Sample data is as follows: Project ID Annual Benefit ($ million) 1.390 Cost Improvement Type County Location Mode Project Life ($ million) 1 1.602 Capacity expansion Capacity expansion Capacity expansion Capacity expansion Capacity expansion Safety Knox I-275 between I-75 & I-40 Roadway 20 2 1.41 0.49 Knox I-40 between Western Ave & 17th street I-75 between US 64 & TN 317 Roadway 20 3 2.683 3.381 Bradley Roadway 20 4 0.742 1.391 Hamilton I-24 at S Seminole Dr. Roadway 20 5 1.570 1.923 Hamilton I-24 between Germantown Rd & Belvoir Ave Patterson at Southern Ave Roadway 20 Shelby Railroad 2238 0.029 0.125 25 11
Results (Overall) Model 0 is the base model (manual allocation) Model 1 and Model 2 maximize benefit Model 3 distributes equitable resources across counties, mode and improvement types Model 4 distributes equitable benefit across counties 674 (Model 4) 9.885 Number of Projects 220 (Model 3) 6.894 690 (Model 2) 9.965 637 (Model 1) 10.369 93 (Model 0) 5.679 Present worth of total benefit in 10 years horizon 0 3 6 9 12 15 Benefit (billion dollars) 12
Results (By Year) Present worth of benefits in billion dollars (number of selected projects) by year Economic Competitiveness I (Model 1) Economic Competitiveness II (Model 2) Equity in Opportunity (Model 3) Equity in Outcome (Model 4) Base model (Model 0) Year 1 1.750 (12) 4.579 (107) 4.545 (113) 4.368 (88) 4.482 (115) 2 0.678 (8) 1.204 (72) 1.131 (61) 0.891 (16) 1.102 (58) 3 0.531 (6) 0.902 (57) 0.847 (51) 0.547 (14) 0.830 (56) 4 0.387 (3) 0.771 (38) 0.747 (56) 0.257 (7) 0.676 (69) 5 1.832 (42) 0.671 (73) 0.625 (70) 0.241 (7) 0.624 (29) 6 0.126 (5) 0.564 (59) 0.538 (59) 0.231 (2) 0.584 (66) 7 0.106 (4) 0.500 (49) 0.483 (65) 0.038 (28) 0.477 (49) 8 0.082 (4) 0.440 (64) 0.407 (77) 0.179 (1) 0.439 (74) 9 0.096 (4) 0.393 (51) 0.340 (63) 0.123 (1) 0.372 (93) 10 0.093 (5) 0.345 (67) 0.302 (75) 0.020 (56) 0.300 (65) Total 5.679 (93) 10.369 (637) 9.965 (690) 6.894 (220) 9.885 (674) 13
Results (By Mode and Improvement Type) Total benefits in billion dollars (number of selected projects) by mode and improvement type Rail Road Model Capacity expansion- Benefit in $ billion(number of projects) Operation- Safety- Safety- Benefit in $ billion(number of projects) Benefit in $ billion(number of projects) Benefit in $ billion(number of projects) 0.936 (5) 1.058 (22) 3.685 (66) 0 (0) Model 0 1.302 (20) 4.325 (515) 4.742 (102) 0 (0) Model 1 0.752 (7) 4.623 (584) 4.590 (99) 0 (0) Model 2 0.984 (22) 1.752 (51) 4.130 (81) 0.028 (66) Model 3 0.931 (14) 4.452 (562) 4.502 (98) 0 (0) Model 4 14
Results by County Model 0 Model 1 Model 2 Model 3 Model 4 15
Sensitivity analysis (Benefit vs Budget) 14 Model 0 Model 1 Model 2 Model 3 Model 4 13 12 11 Benefit (billion dollars) 10 9 8 7 6 5 4 -90 -80 -70 -60 -50 -40 -30 -20 -10 0 10 20 30 40 50 60 70 80 90 Percent change in base budget Base Budget = $95.78 million 16
Benefit vs equity parameter 12 10 8 Benefit (billion dollars) 6 20% decrease in base budget Base budget 20% increase in base budget 10% decrease in base budget 10% increase in base budget 4 2 0 0 0.1 0.2 0.3 0.4 0.5 0.6 0.7 0.8 0.9 1 Equity parameter (e) Equity in Outcome 17
Conclusion Model-1 provides highest benefit but most un-equitable allocation Model-4 provides most equitable benefit and intermediate benefit Model-2 provides intermediate solution of benefit and equity Model-3 provides the most equitable resources but the least benefit Sensitivity analysis is a valuable asset to freight agencies in setting the model parameters during planning phase 18
Acknowledgement This research was funded by Tennessee Department of Transportation (TDOT). The authors would like to thank TDOT for providing data and support during the research period. Also, computational facilities at Intermodal Freight Transportation Institute (IFTI) at University of Memphis are gratefully acknowledged. Any opinions, findings, and conclusions or recommendations expressed are those of the authors and do not necessarily reflect the views of the above-mentioned agencies. 19
Any Questions? Thank You! 20


")
")
")
")
")
")
")

")
")
")
")

")