Understanding High Frequency Trading and Mini Flash Crashes
This presentation delves into the world of high frequency trading and mini flash crashes, examining the causes, characteristics, and impacts of these phenomena. Authors Anton Golub, John Keane, and Ser-Huang Poon provide insights and analyses based on extensive research, shedding light on topics such as liquidity shocks and fleeting liquidity in financial markets.

Download Presentation

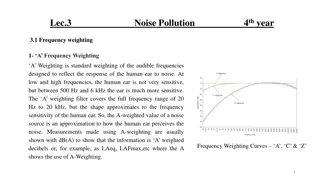
Please find below an Image/Link to download the presentation.
The content on the website is provided AS IS for your information and personal use only. It may not be sold, licensed, or shared on other websites without obtaining consent from the author. Download presentation by click this link. If you encounter any issues during the download, it is possible that the publisher has removed the file from their server.
E N D
Presentation Transcript
High Frequency Trading and Mini Flash Crashes Authors: Anton Golub, John Keane, and Ser-Huang Poon Presented by: Xiumin Li
Authors Anton Golub Used to be a researcher in Manchester Business School of University of Manchester, currently the CEO of a Liquidity provider for digital assets company John Keane PhD Student at The University of Manchester Ser-Huang Poon Professor of Finance at Manchester Business School
Agenda Paper Contents Introduction Background Dataset Descriptive Analyses and Results Liquidity shocks Fleeting Liquidity Conclusion My thoughts
Introduction Regulation National Market System(Reg NMS) High Frequency Trading(HFT) May 6th,2010 Flash Crash Top of the Book Protection-- NBBO Intermarket sweep orders (ISO)
Introduction An example of Mini Flash Crash The figure shows a Mini Flash Crash occurring at NYSE in the stock of Goldman Sachs Group, Inc. (NYSE ticks: GS) on October 7th 2008, resulting in a 1.6% price drop in less than 400 milliseconds. The crash consisted of 58 trades, where the last 57 were marked ISO, for a total volume of 86000 shares, reducing the price $1.89 from its initial values.
BackgroundThe cause of May 6th 2010 Flash Crash The joint report of the SEC and the Commodity Futures Trading Commission (2010) The report attributed a sell order in the eMini S&P 500 futures market as the cause of the Flash Crash. The quote stuffing and delays of data feeds in NYSE Consolidated Quotation System (CQS) created a positive feedback loop set-off the crash. Nanex(2010) HFTs did not trigger the Flash Crash, though their responses caused a hot potato effect on the unusually large selling pressure on that day exacerbated market volatility. Kirilenko et. al. (2011)
BackgroundCharacteristics of Mini Flash Crashes down crash up crash It has to tick down at least 10 times before ticking up; It has to tick up at least 10 times before ticking down; price changes have to occur within 1.5 seconds; price changes have to occur within 1.5 seconds; price change has to exceed - 0.8%. price change has to exceed 0.8%.
Dataset The dataset used in this study includes all quotes disseminated by the Consolidated Quotation System (CQS) and trades disseminated by Consolidated Tape System (CTS) for NYSE, NYSE Amex, NYSE Arca listed securities, and Unlisted Trading Privileges (UTP) Quote Data Feed disseminated quotes and UTP Trade Data Feed disseminated trades for NASDAQ listed securities. The messages are placed in the database as they are aggregated from the Security Information Processor (SIP), and correspond to the information that professional traders receive in real-time. Each message is time stamped to a precision of 25 milliseconds, and contains information relating to time, price, size, exchange issuance and eventual trade or quote condition.
In this study we have analyzed four months of Mini Flash Crashes occurring in September to November 2008, and May 2010. The dataset covers over one-quarter (27.75%) of all Mini Flash Crashes reported to have occurred in the period of 2006-2011. (i) The corresponding periods were highly volatile including the unfolding of the global financial crisis, and the collapse of Lehman Brothers and the May 6th 2010 Flash Crash; (ii) Analysis of Mini Flash Crashes means processing billions of trades and quotes, therefore we selected months with the most crashes.
Descriptive Analyses and Results (i) Avg % Change is the average total percentage price change in a crash. (ii) Avg Time is the average time of the crash in milliseconds; (iii) Avg Trade Vol is the average total volume of the trades; (iv) Avg No of Trades is the average number of trades; (v) ISO Trades is the average number of ISO marked trades, as a percentage of total number of trades.
Descriptive Analyses and Results ISO-initiated Mini Flash Crashes (i) The k mentioned trades can be part of the Order Protection compliance of ISO trades initiated at another exchange, followed by regular marked trades at the domestic exchange, and therefore not a part of the ISO package of trades constituting a Mini Flash Crash that sweeps the order book. (ii) The first k trades may be a part of an auto- routing procedure of another exchange complying with the Order Protection Rule, and therefore not relevant to the mechanics of ISO-initiated Mini Flash Crashes, as the auto- routing procedure will only send the part of the order matching the displayed depth at the Top of the Book, while the remaining balance of the order will be filled elsewhere. The trades constituting the Mini Flash Crash have to be marked ISO, except for the first k trades that can be marked as non-ISO if they are executed within the least aggressive market- wide available best quotes in the previous one second.
Descriptive Analyses and Results Auto-routing initiated Mini Flash Crash Trades constituting the Mini Flash Crash have to be marked as regular, except for the first k trades that can be marked as non- regular if they are executed with the least aggressive market-wide available best quotes in the previous one second. Prior to execution of regular marked trades constituting the Mini Flash Crash, the Top of the Book has to be cleared for all exchanges quoting at the NBBO.
Descriptive Analyses and Results While the two types of Mini Flash Crashes are different in their underlying mechanics, both types are the result of the lack of protection for Depth of Book quotations. Who might be causing Mini Flash Crashes As stressed earlier, most crashes happen due to aggressive use of ISOs. ---HFT activity
Liquidity Shocks Computerized trading improves traditional measures of market quality and contributes to price discovery. Previous Studies Previous studies are bounded by strong assumptions and only provide a summary parameters typical of econometric analysis. Mini Flash Crashes overlooked Examine market quality by placing Mini Flash Crashes at the centre of our analysis with an event study and evaluate the difference in market liquidity 60 seconds before and after the occurrence of Mini Flash Crashes. This Paper
Liquidity ShocksSpread Differences ???????? =????? + ??? 2 ?????? =????? ??? 100% ????????
Liquidity ShocksLocked and Crossed NBBO Quotes Locked and crossed NBBO quotes occur when National Best Bid National Best Offer Rule 611 of Regulation NMS prohibits submission of a quote that would lock or cross the market. Mini Flash Crashes have major impact on the percentage of locked or crossed NBBO quotes, which averaged 8.01% in 60 seconds before the crash, jumps to 24.40% after to crash and declines to 8.23% in the 60 after the crash.
Fleeting Liquidity People are relying on the [stock quote] data and the data is not real. --Sean Hendelman, CEO at T3 Capital Mini Flash Crashes present a unique opportunity to analyze displayed liquidity at a time of severe stress. We note that the phenomenon of Fleeting Liquidity is as often as 37.99% of Mini Flash Crashes in our sample.
Fleeting Liquidity ? ?????????= 1 1 ? ?????????= 1 ln = ? ??? where the function ? equals ? ??? = ?0+ ?1 ?????+ ?2 %?????? ?????+ ?3 ??? ?+ ?4 ????+ ?5 ???????+ ?6 ?????????+ ?7 ????? For ??= ?????,%?????? ?????,??? ?,????,???????,?????????,????? and ? = ?0,?1,?2,?3,?4,?5,?6,?7, We label the predicted variable ???????? with 1 if the predicted probability ??= 1 is 1+? ? ?? ? greater than 0.5, otherwise we label it with 0 (no Fleeting Liquidity).
Fleeting Liquidity Fleeting Liquidity is characteristic of ultra- fast Mini Flash Crashes of small volume and a small number of trades.
Conclusion Mini Flash Crashes are the result of regulatory framework and market fragmentation; in particular due to aggressive use of Intermarket Sweep Orders and Regulation NMS protecting only the Top of the Book. Mini Flash Crashes have an adverse impact on market liquidity resulting in wider spread, increased number of locked and crossed NBBO quotes and decrease in quoted volume. The phenomenon of Fleeting Liquidity associated with Mini Flash Crashes, which is ultra-fast, small volume, and a small number of trades. The paper suggest that regulators pay particular attention to ISO-initiated Mini Flash Crashes and take appropriate actions against market participants responsible for such Mini Flash Crashes.
My thoughts Likes Dislikes Fully Absorbed the previous research findings. Derived the main conclusion based on descriptive analysis Created a method for classifying the mini flash crash. The logit regression model didn t address the main cause of the mini flash crash
Thanks for listening! Any Questions?