Implications of Electricity Trade and Subsidy Removal in MENA Economies
Regional electricity trade in the MENA region can lower electricity supply costs by fostering cross-border transmission and sharing reserves. However, challenges like trading regulations and subsidies hinder full potential utilization. Establishing efficient trade mechanisms could enhance clean energy exchange and optimize existing capacity utilization.

Download Presentation

Please find below an Image/Link to download the presentation.
The content on the website is provided AS IS for your information and personal use only. It may not be sold, licensed, or shared on other websites without obtaining consent from the author. Download presentation by click this link. If you encounter any issues during the download, it is possible that the publisher has removed the file from their server.
E N D
Presentation Transcript
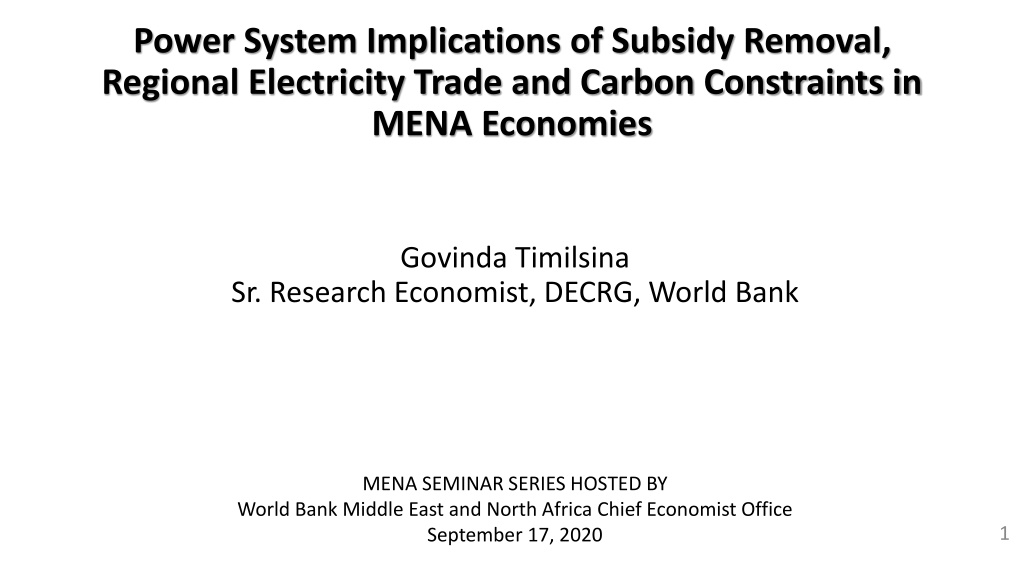
Power System Implications of Subsidy Removal, Regional Electricity Trade and Carbon Constraints in MENA Economies Govinda Timilsina Sr. Research Economist, DECRG, World Bank MENA SEMINAR SERIES HOSTED BY World Bank Middle East and North Africa Chief Economist Office September 17, 2020 1
Acknowledgments Energy GP led study - Pan-Arab Regional Energy Market Initiative (TTL -- Waleed Alsuraih) Ilka F. D. Curiel, co-author, Power System Implications of Subsidy Removal, Regional Electricity Trade, and Carbon Constraints in MENA Economies, World Bank Policy Research Paper, #9297, World Bank, Washington, DC 2
Outline Introduction, Context and Objective Methodology Data and Assumptions Results Conclusions Discussions 3
Introduction (1/2) Regional (cross-border /across-grids) electricity trade reduces the overall cost of electricity supply through multiple channels: - Avoiding additional investments in meeting peak load - Higher utilization of existing capacity through infra-marginal (short-term) trade - Avoiding reserve capacity through sharing reserve margins - Reducing environmental compliance costs through clean energy exchange 4
Introduction (2/2) Many countries/regions have exercised regional electricity trade in different level of trading single regional market, multi-lateral trade, bi-lateral trade - European Network of Transmission Operators for Electricity - Interconnection between Canadian and US electricity grids - Brazil-Uruguay-Argentina cross-border interconnected system - Greater Mekong Sub-regional interconnection - Central American Electrical Interconnection System - Five sub-regional power pools in Africa (Southern, Eastern, Central, Western and Northern) 5
Regional Electricity Trade in MENA (1/2) In MENA, cross-border electricity transmission interconnections already exists at sub-regional and bi-lateral levels. However, for several reasons (absence of trading rules and regulations, prevailing subsidies), only about 2% of the annual regional generation is currently traded. 6
Regional Electricity Trade in MENA (2/2) Maghreb sub-region (Morocco, Algeria, and Tunisia): - Limited cross-border interconnection exist since 1950s - Connected to the European Network in 1997 via the interconnection between Spain and Morocco. Gulf Cooperation Council (Kuwait, Saudi Arabia, Bahrain, Qatar, UAE and Oman): - Started since the GCC Interconnection Authority was established in 2001 and developed in three phases - 1st phase (2009) - GCC northern grid connecting Kuwait, Saudi Arabia, Bahrain, and Qatar - 2nd phase (2011) - GCC southern grid by connecting UAE and Oman - 3rd phase (2013) interconnection between the north and south GCC grids - Recently Iraq also joined EIJLLPST (Egypt, Iraq, Jordan, Libya, Lebanon, West Bank & Gaza, Syria and Turkey) - Established in 1988 7
Objectives Quantification of the gains from the utilization of the existing and committed (being constructed) cross-border transmission networks; Distribution of the gains across the participating countries; Understanding of the difference in gains from electricity trading with and without subsidies in electricity generation Estimation of GHG mitigation potential and corresponding impacts due to regional electricity trade and removal of the subsidies 8
Methodology (1/3) (1/3) A power system planning model (developed in the Bank); The model is an inter-temporal or dynamic optimization model; It determines a sequence of investment decisions for new power generation capacities ensuring the least-cost to meet the projected load satisfying various constraints; The constraints include the resource, technological, environmental, policy, and any other constraints specified by the users; The long-term investment planning and the short-term economic dispatching are part of a single joint optimization process as opposed to two separate stages. 9
Methodology (2/2) Objective function: Minimize the sum of discounted values of total cost that includes capital and fixed O&M costs, fuel costs, variable O&M costs, costs of energy not served, and costs of the reserve not meeting, in all zones (or grids) and for the entire planning horizon (2018-2035). Constraints: Total energy demand = the sum of generation and non-served energy; Available capacity = existing capacity + new capacity - retired capacity; Power generation by individual units follows their ramping rates; Reserves are committed for all the time; Renewable sources are constrained by their resource profiles; Power trade depends on cross-border transmission capacities. 10
Data and Assumptions (1/2) Demand data o The projections of peak load (load forecasts) and energy demand for every five years interval between 2020-2035 Technology data o Existing and planned generation capacities by technology type o Cross-border transmission interconnections between countries o Thermal efficiencies (heat rates) by technology type o Capacity utilization factors by technology type o Economic life of plants by technology type 11
Data and Assumptions (2/2) Economic data o Cost data : capital costs, fixed and variable O&M costs by technology type o Projected fuel price data o Fuel subsidy data o Discount rate Resource data o Potential and profiles of hydro and other renewable energy resources All data and assumptions are provided in the World Bank Policy Research working paper 12
Scenarios or Cases Considered Case name Case 0 Condition SUB, NO CBT Definition of the case Fuels with existing subsidies and no additional electricity trade from the existing level Fuels with existing subsidies and electricity trade utilizing the existing and planned/under construction cross-border transmission interconnections Fuels without subsidies (international price) and no additional electricity trade from the existing level Fuels without subsidies (international price) and electricity trade utilizing the existing and planned/under construction cross-border transmission interconnections Case 1 SUB, CBT Case 2 No SUB, No CBT Case 3 No SUB, CBT Case 4 No SUB, No CBT, CEC No SUB, CBT, CEC CO2emissions limit on top of Case 2 CO2emissions limit on top of Case 3 Case 5 SUB Subsidy; CBT Cross-border trading; CEC Carbon emission constraining 13
Existing and planned cross Existing and planned cross- -border transmission interconnections (MW) border transmission interconnections (MW) (2022) 1200 Syria Lebanon 470 227 350 (2025) 1000 (2025) 200 (2025) 800 1000 (2027) West Bank & Gaza Iraq 500 (2025) 500 (2025) 300 25 Morocco Tunisia 40 Kuwait 1000 (2026) 1100 (2025) 400 1000 (2025) Jordan 1000 (2025) 1000 (2030) 1200 450 Egypt Algeria Bahrain 500 (2025) 600 3000 (2022 Libya 180 200 Qatar 1200 (2025) 1200 KSA 1200 Sudan U.A.E Existing Interconnection 500 (2025) 1200 400 Under construction/ Planned Interconnection Number in parenthesis - Year 1000 (2027) Oman Yemen Source: World Bank (2020)
The Impacts Matrix Impacts Name Condition No CBT, no CEC CBT, no CEC SUB, no CEC No SUB, no CEC No SUB, CEC No SUB, no CBT No SUB, CBT No CEC No CBT CBT No SUB Formula Case 2 - Case 0 Case 3 - Case 1 Case 1 - Case 0 Case 3 - Case 2 Case 5 - Case 4 Case 4 - Case 2 Case 5 - Case 3 Case 3 - Case 0 Case 4 - Case 0 Case 5 - Case 1 Case 5 - Case 2 Case 5 - Case 0 Subsidy removal (SR) impacts Cross-border trade (CBT) impacts Carbon emission constraint (CEC) impacts SR & CBT SR & CEC Combined impacts CBT & CEC ALL THREE SUB Subsidy; CBT Cross-border trading; CEC Carbon emission constraining 15
Total Regional Electricity Supply Costs for 2018-2035 (Billion US$, 2018 price) 1,386 Lowest (US$1,275 billion), in Case 3 when natural gas subsidy is removed, and cross-border trade is allowed; Carbon constraints causes the highest level in the absence of cross-border trade Fuel cost shares the highest (> 50%) Natural gas subsidy accounts for 13-15% The relatively higher share of unmet energy is due to high penalty for not meeting the load ($500/MWh) 16
Impacts on Electricity Supply Costs (%) Subsidy removal (SR) impact No CBT No CEC C2-C0 Regional trade (CBT) ImpactCarbon constraint CBT & CEC Impacts Impacts SR & CBT SR & CEC Impacts All three (CEC) Impact NO SUB NO SUB Impacts NO CBT CBT C4-C2 C5-C3 CBT No CEC C3-C1 SUB No CEC C1-C0 No SUB No CEC C3-C2 SUB CEC C5-C4 NO CBT CBT C3-C0 C4-C0 C5-C1 C5-C2 C5-C0 -1.5 -2.1 -6 -6.7 -9.2 7.1 4.1 -8 5.5 1.9 -2.8 -4.2 Regional trade benefits the highest (9.2% or US$135 billion cost savings) under carbon constraint case The cost savings due to subsidy removal and cross-border trade would be US$111.13 billion (i.e., 8% ) in the absence of carbon constraints 17
Cumulative Electricity Trade in 2018-2035 (TWh) Exports Imports Yemen UAE Cross-border electricity trade would increase by four folds from the current level Tunisia Syria Sudan Saudi Arabia Qatar Saudi Arabia, Jordan, Egypt, and Qatar are the major exporters, Saudi Arabia, Egypt, and Kuwait are the major importers West Bank and Gaza CO2 constraint without subsidy Without subsidy CO2 constraint without subsidy Oman Without subsidy CO2 constraint without subsidy Morocco With subsidy With subsidy Libya Lebanon Kuwait Jordan Iraq Egypt Bahrain 18 Algeria+ 0 100 200 300 400 0 100 200 300 400
Value of Electricity Trade in 2018-2035 (Million US$, 2018 Price) Yemen The region will gain between US$752 million (no carbon constraint) and US$1,282 million (carbon constraint) in 2018-2035 period. UAE Tunisia Syria CO2 constraint without subsidy Sudan Saudi Arabia In the absence of CO2 constraints, Egypt, Lebanon, Syria and Kuwait would receive the highest gains from electricity trade, and Bahrain, Morocco and Iraq would receive the lowest, no matter whether the natural gas subsidy is removed or not. Without subsidy Qatar West Bank and Gaza With subsidy Oman Morocco Libya Lebanon Kuwait When the CO2 constraint is in place, Jordan replaces Kuwait in the list of top four beneficiaries. Bahrain and Iraq would still be gaining the least. Jordan Iraq Egypt Bahrain Algeria 19 0.0 50.0 100.0 150.0 200.0 250.0 300.0
New Capacity Addition for Electricity Generation during 2018-2035 (GW) 600 Gas combined cycle Hydro Solar Wind Gas turbine Diesel generation Oil and gas steam turbine Nuclear The CC generation would be added the highest (36-54% of total capacity addition) 500 400 300 200 This is followed by solar power (26-38%) and wind (6-15%) 100 - Case 0 (Subsidy, No trade) Case1 (Subsidy, Trade) Case 2 (No subsidy, No trade) Case 3 (No subsidy, Trade) Case 4 (No subsidy, No trade, CO2 constraint) Case 5 (No subsidy, Tade, CO2 constraint) 20
Changes in Capacity Addition during 2018-2035 (GW) Electricity Generation No CBT, Technology No CEC SR Impacts CBT Impacts No SUB No CEC CEC Impacts NO SUB NO SUB Impacts NO CBT CBT SR & CBT SR & CEC Impacts CBT & CEC Impacts All Impacts CBT, No CEC SUB, No CEC SUB, CEC NO CBT CBT Gas CC -28 -44 -2 -18 -14 19 24 -46 -9 -20 6 -22 Gas GT -3 0 -8 -5 -7 -9 -11 -8 -13 -11 -16 -20 Hydro -1 0 0 1 0 3 2 0 2 2 3 2 Diesel IC 0 0 0 0 0 0 0 0 0 0 0 0 Solar 23 19 -1 -4 -35 87 56 19 109 75 52 75 Gas\Oil ST 0 1 2 3 0 -2 -4 3 -1 -3 -2 -2 Wind 30 44 1 15 -1 21 4 45 51 48 19 49 Nuclear 21 27 0 6 8 10 11 27 31 39 17 39 Coal 0 0 -2 -2 0 -4 -2 -2 -4 -1 -4 -4 Total 42 48 -10 -4 -49 125 80 37 166 128 76 118 Cross-border trading reduces the new capacity requirement by 4 to 49 GW; Subsidy removal and carbon constraints does not reduce new capacity addition; Carbon constraints causes significant increase in total capacity as solar and wind have lower capacity factors 21
Changes in Electricity Generation Mix during 2018-2035 (Percentage Point) Electricity Generation No CBT, Technology No CEC No CEC No CEC SR Impacts CBT Impacts CEC Impacts SR & CBT SR & CEC Impacts CBT & NO SUB Impacts NO CBT CBT All CEC Impacts CBT, SUB, No SUB SUB, NO SUB CBT Impacts No CEC CEC NO CBT Gas CC -6.32 -9.57 -0.39 -3.64 -1.48 -3.75 -1.59 -9.96 -10.07 -11.16 -5.23 -11.54 Gas GT -0.8 -0.88 -0.26 -0.34 -0.18 -0.65 -0.49 -1.14 -1.45 -1.37 -0.83 -1.63 Hydro 0 0 0.05 0.05 0 0.16 0.12 0.05 0.16 0.11 0.16 0.16 Diesel IC 0 0 -0.01 -0.01 -0.03 0.03 0.02 -0.01 0.03 0.01 0 0 Solar 1.47 1.63 -0.04 0.12 -0.17 2.47 2.19 1.58 3.94 3.81 2.3 3.77 Gas\Oil ST -0.01 0.14 0.6 0.75 0.15 -0.76 -1.37 0.74 -0.77 -1.23 -0.62 -0.63 Wind 3.22 4.59 0.55 1.92 0.62 1.5 0.2 5.14 4.72 4.79 2.11 5.33 Nuclear 2.26 3.86 0 1.61 0.94 1.85 1.19 3.86 4.11 5.06 2.8 5.05 Coal 0.18 0.23 -0.5 -0.45 0.15 -0.86 -0.26 -0.26 -0.67 -0.02 -0.71 -0.52 Electricity generation from the gas-fired combined cycle technology gets affected the most in all cases; 22
Impacts on Power Sector GHG Emissions during 2018-2035 (%) -0.1 -3.2 -7.1 -7.4 -9.5 -9.9 -10.0 -10.3 -16.6 No trade Trade Subsidy No subsidy No trade Trade Subsidy removal effect Cross-broder trade effect CB trade & subsidy removal CO2 limit effect CO2 limit & CB trade CO2 limit, CB trade & subsidy removal SR & CBT causes higher reduction of GHG than CEC; To reduce about the same level of GHG emissions, CEC increase total electricity supply costs by 7%, whereas SR & CBT reduces it by 8%. CBT enhances the CO2 reduction effects of SR; SR enhances the CO2 effects of CBT. 23
Conclusions The study measured the power sector impacts of three policies (removal of fuel subsidies, cross-border electricity trade, and carbon constraints), separately and jointly ; The subsidy removal and enhanced regional trade utilizing existing cross-border transmission networks would save US$111 billion costs of electricity supply in MENA region during the 2018-2035 period. These two policies would reduce 10% of power sector CO2 emissions during the study period, if carbon pricing is adopted to achieve the same level of emission reduction it would increase the supply costs by 7%. These three policies are highly interactive, and they together would reduce 16% of CO2 emissions with 4% increase in total costs of electricity supply. 24
Installed Capacity in 2018 (MW) Installed Capacity in 2018 (MW) Economy GT CC 10,368 700 7,845 15,079 188 2,925 140 4,638 1,230 2,352 ST 2,435 125 14,799 5,995 242 9,354 1,694 1,190 600 DG Hydro Coal Wind PV CSP Total 20,579 3,932 38,939 30,320 4,824 18,845 3,017 9,851 8,819 9,600 1,155 11,878 84,773 4,478 8,662 6,138 31,577 1,492 298,878 Algeria Bahrain Egypt Iraq Jordan Kuwait Lebanon Libya Morocco Oman West Bank & Gaza Qatar Saudi Arabia Sudan Syria Tunisia UAE Yemen Total 6,907 3,096 12,647 4,952 2,837 6,496 930 3,995 834 7,099 1,140 7,470 21,436 458 2,800 2,559 21,644 - - - 276 - - - - - - - - 10 432 10 50 150 - 1 - 2,832 2,524 747 20 1,769 810 - - - - - - 287 10 460 10 - - - 50 253 - - - - - - - - - - - - - 28 292 149 15 1,770 2,895 1,018 180 - - - - - - - - - - - - - - - - - - - - - - - - - 4,408 31,841 220 967 2,218 6,944 407 92,470 - 31,226 906 3,324 1,080 2,460 495 75,925 270 535 2,250 1,571 110 - - - - - - 62 208 10 31 373 125 - - - - - 590 4,461 - - 107,300 11,539 3,005 2,309 1,345 525 26 Source: World Bank (2020)
Candidate Capacity in 2018 Candidate Capacity in 2018- -2035 (MW) 2035 (MW) IGCC Economy GT 10,800 4,125 2,430 15,000 3,000 9,350 570 250 2,400 1,245 650 3,549 12,913 CC ST DG Hydro Nuclear Coal Wind PV CSP Total 11,070 4,231 25,641 33,000 7,600 9,460 - - - - - - - - - - - - Algeria Bahrain Egypt Iraq Jordan Kuwait Lebanon Libya Morocco Oman West Bank & Gaza Qatar Saudi Arabia Sudan Syria Tunisia UAE Yemen Total - - - - - - - - - - - - - - - - - - - 70 200 105 179 2,500 1,100 - - - - - 1 7,940 2,500 10,550 13,000 900 32 2,400 1,950 160 - - - - - - - - - - - - - 2,000 600 - - - - - - - - - - - 60 51 15 50 747 6,002 13,839 1,573 650 3,749 23,328 997 210 460 6,539 126 - - 2,910 2,800 - 27 - - - - 38 1,375 3,026 3,011 3,339 200 650 - - - 78 - - - - - - - - 50 - - - - - - - - - - - - - - - 200 300 1,995 30 4,490 3,200 400 - - - - - - - - - - - - - - 37 360 - - - 600 - - 100 450 2,299 - - - - - - - - - - - - 100 10 10 - - - 1,440 2,800 - - - - - - 1,995 69,131 13,380 33,218 115 1,893 10,400 5,576 4,419 8,269 700 149,096 27 Source: World Bank (2020)
Peak load and energy demand forecasts (Annual Average, %) Peak load 2025-30 3.8% 3.4% 5.4% 0.6% 4.8% 2.1% 2.8% 2.5% 4.5% 5.0% 4.4% 1.8% 2.1% 13.0% 3.7% 3.8% 5.0% 4.8% 3.5% Energy demand 2025-30 4.0% 3.7% 5.5% 3.8% 5.1% 2.6% 2.7% 2.8% 4.8% 5.4% 4.4% 1.8% 2.2% 13.4% 3.8% 4.6% 3.7% 5.0% 4.0% Economy 2020-25 4.0% 3.1% 5.7% 1.2% 5.0% 4.9% 2.8% 2.9% 5.0% 5.2% 5.1% 2.6% 3.9% 12.8% 4.0% 4.8% 6.0% 5.0% 4.2% 2030-35 4.0% 3.9% 5.5% 3.9% 5.9% 2.6% 2.7% 2.7% 4.8% 5.0% 4.4% 1.8% 2.8% 13.1% 3.8% 4.6% 3.7% 5.9% 4.4% 2020-25 4.2% 3.9% 6.2% 4.3% 5.3% 5.4% 3.2% 3.3% 5.6% 5.9% -2.2% 2.6% 4.0% 12.9% 4.1% 5.5% 4.2% 5.3% 4.7% 2030-35 4.0% 3.9% 5.5% 3.9% 5.9% 2.6% 2.7% 2.7% 4.8% 5.0% 4.4% 1.8% 2.8% 16.1% 3.9% 4.6% 3.7% 6.1% 4.5% Algeria Bahrain Egypt Iraq Jordan Kuwait Lebanon Libya Morocco Oman West Bank & Gaza Qatar Saudi Arabia Sudan Syria Tunisia UAE Yemen Total Source: Energy ministries, national electricity utilities and the Arab Forum for Environment and Development (AFED) 28
Costs and heat rate data Capital Cost (Million US$/MW) Heat Rate (MMBtu/ MWh) Fixed O&M cost ($/MW-yr) Variable O&M Cost ($/MWh) Technology Fuel Gas turbine Oil 9.75 9.75 0.81 0.81 8,100 8,505 4.05 4.46 Natural gas Combined cycle Natural gas 6.0 1.22 8,370 2.24 Steam turbine Coal Oil 8.74 9.45 9.45 2.9 2.5 2.5 32,100 10,530 10,530 4.61 2.37 2.37 Natural gas Diesel plant ISCC Diesel Natural gas 9.85 7.45 0.7 3.77 10,000 31,180 10 4.42 Hydro Wind Solar PV Solar CSP Nuclear Water Wind Sun Sun Uranium - - - - 2.00 1.49 0.97 4.4 5.5 14,130 31,000 10,000 40,000 96,200 - - - 4 10.48 2.21 Source: KFUPM, 2011, World Bank (2009); IEA (2014) 29
Non Non- -subsidized fuel prices (US$/MMBTU) subsidized fuel prices (US$/MMBTU) 2035 Fuel Coal 2018 2020 2025 2030 4.00 4.30 4.80 5.30 5.30 Diesel 10.00 15.20 19.10 19.10 19.10 Heavy crude oil (HCR) 7.80 11.80 14.90 14.90 14.90 Heavy fuel oil (HFO) 7.80 11.80 14.90 14.90 14.90 Light Crude Oil (LCR) 8.60 13.00 16.40 16.40 16.40 Arabian super light crude (SLCR) 11.80 15.80 18.90 18.90 18.90 Liquefied natural gas (LNG) 6.31 8.03 10.80 11.96 11.96 Refuse (REF) 4.00 4.30 4.80 5.30 5.30 Shale oil 0.40 0.50 0.60 0.70 0.70 Uranium 0.67 0.67 0.67 0.67 0.67 Source: World Bank (2016a) for coal and crude oil; USEIA (2018) for petroleum 30
Local (subsidized) natural gas prices (US$/MMBTU) Economy 2018 2020 2025 2030 2035 Algeria Bahrain Egypt 4.50 5.00 5.00 4.50 5.00 5.00 5.50 6.00 6.00 6.50 7.00 7.00 6.50 7.00 7.00 Iraq Jordan Kuwait Lebanon Libya Morocco Oman West Bank and Gaza Qatar Saudi Arabia Sudan Syria Tunisia UAE Yemen 4.00 5.00 5.00 5.50 4.30 5.00 3.50 4.50 5.00 5.00 4.00 5.00 5.00 5.50 4.30 4.00 5.00 5.00 5.50 4.50 5.00 3.50 4.50 5.00 5.00 4.00 5.00 5.00 5.50 4.50 4.50 6.00 6.00 6.50 5.50 6.00 4.50 5.50 6.00 6.00 4.50 6.00 6.00 6.50 5.50 5.00 7.00 7.00 7.50 6.50 7.00 5.00 6.50 7.00 7.00 5.00 7.00 7.00 7.50 6.50 5.00 7.00 7.00 7.50 6.50 7.00 5.00 6.50 7.00 7.00 5.00 7.00 7.00 7.50 6.50 Source: World Bank (2020) 31
Existing and planned cross Existing and planned cross- -border transmission interconnections (MW) border transmission interconnections (MW) (2022) 1200 Syria Lebanon 470 227 350 (2025) 1000 (2025) 200 (2025) 800 1000 (2027) West Bank & Gaza Iraq 500 (2025) 500 (2025) 300 25 Morocco Tunisia 40 Kuwait 1000 (2026) 1100 (2025) 400 1000 (2025) Jordan 1000 (2025) 1000 (2030) 1200 450 Egypt Algeria Bahrain 500 (2025) 600 3000 (2022 Libya 180 200 Qatar 1200 (2025) 1200 KSA 1200 Sudan U.A.E Existing Interconnection 500 (2025) 1200 400 Under construction/ Planned Interconnection Number in parenthesis - Year 1000 (2027) Oman Yemen Source: World Bank (2020)


")
")
")
")

")
")
")
")


")
")


")

")


")

")


 natural gas prices (US$/MMBTU)")