Committee Report on Budget and Finance at QUFA Annual Meeting
The committee report presented at the QUFA Annual Meeting on April 27, 2023, highlighted the key members, terms of reference, causes of financial problems at universities, demographics, strategic misadventures, important notes regarding financial data, and various sources used for financial analysis.

Download Presentation

Please find below an Image/Link to download the presentation.
The content on the website is provided AS IS for your information and personal use only. It may not be sold, licensed, or shared on other websites without obtaining consent from the author. Download presentation by click this link. If you encounter any issues during the download, it is possible that the publisher has removed the file from their server.
E N D
Presentation Transcript
Budget and Finance Committee Report QUFA Annual Meeting April 27, 2023
Committee Members Leslie Jermyn Jordan Morelli John Rose Scott Yam Michael White (chair) Library and Archives QUFA staff QUFA President QUFA staff Electrical and Computer Engineering
Terms of Reference 1) Review and analyze Queen s budgeting and finances 2) Alert QUFA leadership if there are signs of Queen s impending financial contraction or collapse of an order that could impact QUFA Members jobs either through re-assignment or redefinition of terms of employment, or by way of contraction of the delivery of academic programs.
What are the principal causes of financial problems at universities?
DEMOGRAPHICS Image: Yinan Chen - www.goodfreephotos.com (gallery, image), Public Domain, https://commons.wikimedia.org/w/index.php?curid=33633818a
Strategic Misadventures Image: McKernan, B. (2019, Jan. 28). Fate of castles in the air in Turkey s 151m ghost town. The Guardian, https://www.theguardian.com/world/2019/jan/28/fate-of-castles-in-the-air-in-turkeys-151m-ghost-town
Notes University-level financial data is readily available. Faculty- and department-level financial data is generally not available. Annual financial reports provide only a snapshot of the financial health of an institution. Long-term trends are much better indicators of financial health. Universities do not go bankrupt overnight. The warning signs are often present years or even decades before a crisis hits.
Sources Financial statements Budget reports Office of Planning and Budget Student enrolments Employee headcounts Common University Data Ontario (CUDO) Council of Ontario Financial Officers (COFO) OCUFA University Finance Committee University finance dashboard
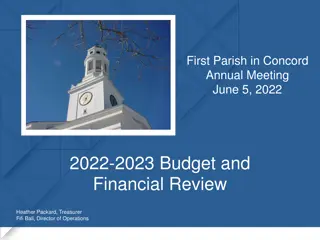
Queens University in 1920 Queen s Library and Archives: McCarthy Aero Service Ltd. Aerial View of Queen s University, 1920.
Revenue and Expenses 2019: Queen s becomes a billion $ organization (In millions) $1,200.00 $1,000.00 $800.00 $600.00 $400.00 $200.00 $0.00 2011 2012 2013 2014 2015 2016 2017 2018 2019 2020 2021 2022 Revenue Expenses Source: Queen s University Consolidated Financial Statements, 2011-2022
Total Operating Revenue by Source Source: Queen s University Budget Report, 2021-2022, p. 16
Commentary The University ended the fiscal year with a deficit of $3.3 million, driven largely by weak investment returns in the wake of high inflation and rising interest rates. The strong investment returns experienced in 2021 provided capacity to counter the weak returns of the current year, but the $148.9 million decrease in investment income is an extreme example of the volatility in investment returns that are possible from one year to the next. The current year s deficit was funded through the depletion of University reserves, flexibility that will continue to be eroded in coming years with government constraints on domestic enrolment, tuition frameworks, and grant funding. Donna Janiec, VP (Finance & Admin.) Source: Queen s University Consolidated Financial Statements, 2021-2022, p. 2
Assets and Liabilities (In millions) $4,000.00 $3,500.00 $3,000.00 $2,500.00 $2,000.00 $1,500.00 $1,000.00 $500.00 $- 2011 2012 2013 2014 2015 2016 2017 2018 2019 2020 2021 2022 Assets Liabilities Source: Queen s University Consolidated Financial Statements, 2011-2022
Assets (Endowments, Internally Restricted, Unrestricted, and Invested in Capital Assets) (In millions) $1,600.00 $1,400.00 $1,200.00 $1,000.00 $800.00 $600.00 $400.00 $200.00 $- 2011 2012 2013 2014 2015 2016 2017 2018 2019 2020 2021 2022 -$200.00 -$400.00 Endowments Internallly Restricted Invested in Capital Assets Unrestricted Source: Queen s University Consolidated Financial Statements, 2011-2021
Cash (Asset) (in millions) 180.00 160.00 140.00 120.00 100.00 80.00 60.00 40.00 20.00 0.00 2011 2012 2013 2014 2015 2016 2017 2018 2019 2020 2021 2022 Cash
Long-term Debt (Liability) (in millions) $125 million loan @ 2.89%, due 2063 $450.00 $400.00 $350.00 $300.00 $250.00 $200.00 $150.00 $100.00 $50.00 $0.00 2011 2012 2013 2014 2015 2016 2017 2018 2019 2020 2021 2022 LTD Source: Queen s University Consolidated Financial Statements, 2011-2021
Operating Fund (Accounting basis) (in millions) $800.00 $700.00 $600.00 $500.00 $400.00 $300.00 $200.00 $100.00 $0.00 2012 2013 2014 2015 2016 2017 2018 2019 2020 2021 2022 Revenue Expenses Source: Queen s University Consolidated Financial Statements, 2011-2021
Enrolments (FTE and part-time) 2021-22: +0.36 % 40000 33842 33719 35000 31785 2011-21: +38.5 % 30386 29609 28272 30000 27257 27149 26982 26780 26052 25997 24788 24777 24343 24270 24042 23228 25000 22472 22253 21619 2021-22: +1.02 % 20529 20282 19861 20000 15000 2011-21: +33 % 2011-21: +65.9 % 2021-22: -2.25 % 10000 6737 6585 5733 5598 5339 5044 4677 4527 4378 4248 4181 4061 5000 0 2011 2012 2013 2014 2015 2016 2017 2018 2019 2020 2021 2022 Undergraduate Graduate Total Source: Queen s Office of Planning and Budget
International Students 4000 ~5.3 % of total in 2011 ~10.2 % of total in 2021 ~9.9 % of total in 2022 3500 3000 2500 2000 1500 1000 500 0 2011 2012 2013 2014 2015 2016 2017 2018 2019 2020 2021 2022 Undergraduate Graduate Source: Institutional Research and Planning
Student Enrolment Shortfalls against the budget were observed in international enrolment ($31.5M) primarily for the Faculty of Arts & Science, Faculty of Engineering and Applied Science, and Faculty of Health Sciences. The majority of the decline in expected international enrolment is the result of lower than budgeted intake, as well as lower than planned retention across various programs, predominantly in the Faculty of Arts and Science. Source: Board of Trustees Report, Financial Projection, Feb. 17, 2023, p. 4
Tenure-track and Adjunct Faculty 1400 1200 1000 800 600 400 200 0 2011 2012 2013 2014 2015 2016 2017 2018 2019 2020 2021 2022 Tenure Track Adjuncts (All) Contimuing Adjuncts Note: Term adjunct data not available, 2011-2017 Source: Queen s Office of Planning and Budget, QUFA Office
Employees by Appointment Type 3000 2500 2000 librarians and archivists 1500 1000 500 0 Adjunct faculty Clinical faculty Regular faculty Postdocs Academic related General staff Research-contract 2018 2019 2020 2021 2022 Source: Institutional Research and Planning, Office of Planning and Budgeting
Indexed Employees by Type (2018 = 100) 180 160 140 120 100 80 60 2018 2019 2020 2021 2022 Adjunct faculty Clinical faculty Regular faculty Postdocs Academic related General staff Research-contract
Faculty Appointments by Faculty 900 800 700 600 500 2018 Business includes Policy Studies 400 300 200 100 0 Arts & Science Business Education Engineering Health Sciences Law Shared Services 2018 2019 2020 2021 2022 Source: Institutional Research and Planning, Office of Planning and Budgeting
Indexed Faculty Appointments (2018 = 100) 160 150 140 130 120 110 100 90 80 70 60 2018 2019 2020 2021 2022 Arts & Science Business Education Engineering Health Sciences Law Shared Services
Staff Appointments by Faculty 1800 1600 1400 1200 1000 800 600 400 200 0 Arts & Science Business Education Engineering Health Sciences Law Shared Services 2018 2019 2020 2021 2022 Source: Institutional Research and Planning, Office of Planning and Budgeting
Indexed Staff Appointments (2018 = 100) 160 150 140 130 120 110 100 90 80 70 60 2018 2019 2020 2021 2022 Arts & Science Business Education Engineering Health Sciences Law Shared Services
QU Financial Statement Summary Change Change 2011 2021 2022 Revenue $742.5 million $1,095.3 million 47.5 % $1,008.8 million -0.33 % Expenses $751.2 million $950.5 million 26.5 % $1,012.1 million 6.5 % Op fund revenue $435.9 million $752.9 million 72.7 % $684.63 million -9.1 % (2014) Op fund expenses $398.5 million $662.1 million 66.1 % $706.89 million 6.8 % (2014) Assets $1,701.6 million $3,393 million 99.4 % $3,397 million 0.1 % Endowments $557.7 million $1,393.7 million 149.9 % $1,407 million 1 % Cash $66.1 million $165.6 million 150.5 % $118.9 million -28.2 % Liabilities $970.5 million $1,402.6 million 44.5 % $1,374.3 million -2 % Long-term debt $227.17 million $381.15 million 67.8 % $376.81 million -1.1 % Enrolment (ft+pt) 24,343 33,719 38.5 % 33,842 0.36 % Faculty (TT/CA) 792/105 860/134 8.6%/27.6% 866/? 0.69 % / ?
Summary Annual financial reports provide only a snapshot of the financial health of an institution. Long-term trends are much better indicators of financial health. Universities do not go bankrupt overnight. The warning signs are often present years or even decades before a crisis hits. Financial problems often arise due to demographic challenges (declining enrolment) or strategic misadventures (costly buildings or new campuses).
Revenues, expenses, long-term debt From 2011-2021, Queen's revenues increased 47.5 percent while its expenses have increased only 26.5 percent. In 2019, Queen's had revenues of more than $1 billion. Since 2013, Queen's has had annual surpluses totaling $618 million and one annual deficit of $3.3 million. Long-term debt was relatively stable from 2011-2015 at about $225 million. It increased 15 percent in 2016 to $276 million. It increased again in 2020 by 46 percent to $385 million. The 2020 increase was mainly due to the University establishing a series B unsecured debt of $125 million at 2.89 %, which matures in April 2060.
Enrolment and Faculty Positions Since 2011, undergraduate student enrolment has increased 34.4 percent, from 20,282 in 2011 to 27,257 in 2022. From 2011-2021, graduate student enrolment increased 65.9 percent, from 4,061 to 6,737. Graduate enrolment declined 2.25 percent in 2022 due to lower domestic enrolment. Total student enrolment has increased 38.5 percent, from 24,343 in 2011 to 33,842 in 2022. International student enrolment as a percentage of total enrolment has increased from ~5.3 percent in 2011 to ~10.2 percent in 2021. From 2009 through 2016, full-time faculty positions decreased from 815 to 766. Since the launch of the faculty renewal program in 2016, full-time faculty positions have increased to 866.
Financial Projection, Dec. 31, 2022 The Operating Fund projection reflects student fee revenue that is $43.9 million lower than budget. This is primarily the result of lower undergraduate international student enrolment as well as lower enrolment in professional graduate programs. This has resulted in a projected deficit of $28.2 million, as a result of planned Faculty draw- down of reserves. Consistent with prior years, the projected deficit is lower than budgeted ($43.5 million) primarily due to deferral of renovations and delayed hiring as well as planned contingencies reflecting anticipated revenue shortfalls. The Pooled Investment Fund (PIF) has experienced gains to date of $14.3 million as at January 31, 2023, which are not reflected in the above deficits. Given the volatility of financial markets, projected revenue for the PIF remains at the budgeted amount of $5.2 million. Source: Board of Trustees Report, Financial Projection, Feb. 17, 2023, p. 1


")
")
")
")


")

")

")