Improving Behavioral Health and Developmental Disabilities Outcomes Conference Summary
The focus of the conference was on new indicators introduced in Q3 2020, such as time to completion of BPS, time to first service SUD, and time to completion of BPS to first service. The need for revising indicators was highlighted to enhance performance measurement and quality improvement, aligning with the objectives of the public behavioral health system. Decisions made by the Performance Indicator Workgroup aimed to address issues with comparing measures and ensure accessibility of services. The conference emphasized putting people first to help all Michiganders lead healthier, more productive lives.

Download Presentation

Please find below an Image/Link to download the presentation.
The content on the website is provided AS IS for your information and personal use only. It may not be sold, licensed, or shared on other websites without obtaining consent from the author. Download presentation by click this link. If you encounter any issues during the download, it is possible that the publisher has removed the file from their server.
E N D
Presentation Transcript
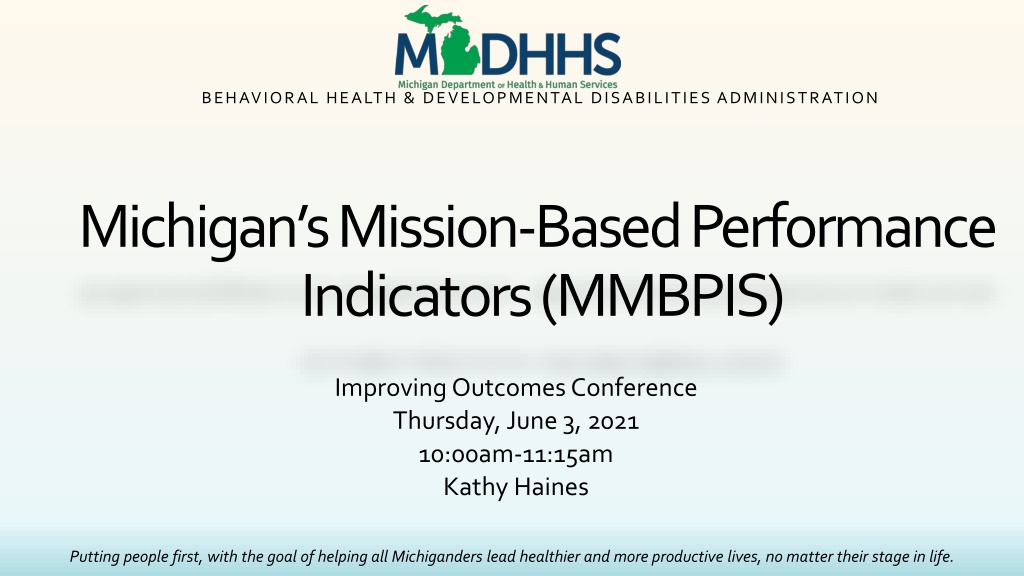
BEHAVIORAL HEALTH & DEVELOPMENTAL DISABILITIES ADMINISTRATION Michigan s Mission-Based Performance Indicators (MMBPIS) Improving Outcomes Conference Thursday, June 3, 2021 10:00am-11:15am Kathy Haines Putting people first, with the goal of helping all Michiganders lead healthier and more productive lives, no matter their stage in life.
For Today Focus on the three indicators that were new for Q3 2020. Time to completion of BPS (indicator #2) Time to first service SUD (indicator #2e) Time to completion of BPS to first service (indicator #3) Background brief recap on decisions made. Motivation for revision to indicators Key decisions on specifications Some data observations Next steps Q & A 2
Need for Indicator Revision Over time performance on the MMBPIS measures improved to where there was very little variation During 1st years of performance PIHPs did well on many indicators, however there were clear areas for improvement By FY17, most results near or above standard. Measures did not point to those areas in need of improvement CMS and HSAG had both commented that the indicators no longer pointed to areas of improvement. BHDDA leadership had agreed changes were needed to the indicators in order to meet the following: Performance indicator system needs to be explainable & defensible to CMS and other key stakeholders Ensure that rationale for use is clear and relevant to key objectives in our system Performance indicator system needs to facilitate quality improvement and identify those areas in need of improvement. 3
Decisions of Performance Indicator Workgroup Issues with Comparing to Other Measures - Example Example One Example Two % Discharge from Substance Abuse Detox unit who are seen for f/u with 7 days. F/u after Hospitalization for mental illness within 30 days. PIHP Indicator 4a Q1 2018: adults: 97.0%; children: 96.5% PIHP indicator 4b Q1 2011, statewide: 98.54% HEDIS measure, 7/1/2016-6/30/2017: adults: 64%; children: 75% As calculated from encounter data for July 1 September 30, 2011, statewide: 57% 4
Decisions of Performance Indicator Workgroup Aligning with Objectives of Public Behavioral Health System Indicator #2 Rationale: Quick, convenient entry into the public mental health system is a critical aspect of accessibility of services. Delays in clinical and psychological assessment may lead to exacerbation of symptoms and distress and poorer role functioning. The amount of time between a request for service and clinical assessment with a professional is one measure of access to care. Additional rationale noted by workgroup members: On MH/IDD side the assessment piece is especially important because fostering a connection to necessary supports while the person is motivated towards treatment is critical to the engagement process. In addition, CMHSPs can refer the person out to alternate providers outside the public specialty behavioral health care system if they do not meet criteria for specialty services. The completed assessment process is critical for person-centered planning. Broaden indicator to include the entire assessment process that contributes to the determination of the service and treatment needs of the person. This approach is consistent with the definition of assessment in the Medicaid Provider Manual Concern that by only measuring the start of the assessment process, we would miss a lot of issues that occur with obtaining needed information from the consumer, guardians and outside entities. Examining these issues would help identify opportunities for improvement. 5
Decisions of Performance Indicator Workgroup Aligning with Objectives of Public Behavioral Health System Indicator #2e Rationale: Quick, convenient entry into the public behavioral health system is a critical aspect of accessibility of services. Delays may lead to exacerbation of symptoms and distress and poorer role functioning and disengagement of the person from the treatment system. The amount of time between a request for service and the delivery of needed treatments and supports is one measure of access to care. Additional rationale noted by workgroup members: This separate indicator for individuals with substance use disorders is important as specialty behavioral health manages the entire substance use disorder benefit. In comparison, individuals who request mental health services may, through assessment, be determined not eligible for specialty behavioral health services. This indicator reflects the emphasis of transitioning individuals who are approved for SUD services directly to ongoing face-to- face services 6
Decisions of Performance Indicator Workgroup Aligning with Objectives of Public Behavioral Health System Indicator #3 Rationale: The amount of time between the professional assessment and the delivery of medically necessary treatments and supports addresses a different aspect of access to care than Indicator #2a. Delay in the delivery of necessary services and supports may lead to exacerbation of symptoms and distress and poorer role functioning and disengagement from the system. Additional rationale noted by workgroup members: The timely start of on-going services is critical to the engagement process, connecting the consumer to services and supports while the person is motivated towards treatment. 7
Decisions of Performance Indicator Workgroup Key Technical and Measurement Decisions Removal of exceptions. Clearly document indicator specifications in order to remove variation in measurement across PIHPs and CMHSPs. Develop a Standard after at least two years of measurement. Conduct performance improvement initiatives to address performance related to indicators #2a, #2b and #3. 8
Data Observations The averages for the new indicators are clearly below the 95% level. Most likely result of removal of exceptions. In addition, COVID emergency has most likely impacted results. There is variation across the PIHPs with some showing higher rates than others. Most likely indicates opportunity for improvement. May also indicate measurement error and that indicator specification not being used consistently across the state. 9
MMBPIS Data: www.Michigan.gov/bhdda / Click On: Performance Indicator System Mental Health Statistics and Reports Michigan s Mission-Based
Data Observations PIHP Averages and Counts #2a - The percentage of new persons during the quarter receiving a completed biopsychosocical assessment within 14 calendar days of a non-emergency request for service. Indicator #2a all populations Q3 2020 Q4 2020 Q1 2021 PIHP Average 72.34% 69.89% 67.98% Standard deviation 6.81% 8.53% 8.24% N Number of new persons requesting IDD or MH Services 9,315 14,043 13,712 11
Data Observations PIHP Averages and Countsunts #2e - The Percentage of New Persons During the Quarter Receiving a Face-to-Face Service for Treatment or Supports Within 14 calendar days of a Non-emergency Request for Service for Persons with Substance Use Disorders. Indicator #2b SUD Q3 2020 Q4 2020* Q1 2021 PIHP Average 77.5% 77.11% 74.56% Standard deviation 11.34% 10.06% 10.39% N Total Requests (Admissions + Expired Requests) 13,094 16,808 16,688 *Q4 One PIHP did not report. 12
Data Observations PIHP Averages and Counts Indicator 3: Percentage of New Persons During the Quarter Starting any Medically Necessary On-going Covered Service Within 14 Days of Completing a Non-Emergent Biopsychosocial Assessment. Indicator #3 all populations Q3 2020 Q4 2020 Q1 2021 PIHP Average 83.83% 81.36% 79.23% Standard deviation 8.72% 8.56% 10.73% N Number of persons with IDD or MH completing a BPS 7,481 10,004 10,780 13
Measurement Issue Indicator 2e Number of New Persons Who Were approved for SUD Treatment or supports Expired Requests reported by the PIHP. Approved requests that do not result in a BH-TEDS admission within 60 days. Report expired requests for the quarter in which the request expired. Count of BH-TEDS SUD Admission records for the quarter. Time to Treatment reported in BH-TEDS Calculations by BHDDA. 16
Difficulty Collecting Expired Requests Several of the PIHPs are undercounting Expired Request. Not capturing requests made directly to outpatient providers (e.g., only detox, MAT, and residential clients are required to go through their Access Center). Gives the appearance of better performance to those who can t track all requests in the EMRs. Take a look at percentage of total requests that are expired requests: 17
The Percentage of Requests that are Expired, Q1 2021 Taken from Indicator 2e: New Persons During the Quarter Receiving a Face-to-Face Service for Treatment or Supports Within 14 calendar days of a Non-emergency Request for Service for Persons with Substance Use Disorders Requests Percentage of Request that Expired # of Non-Urgent Admissions to a Licensed SUD Treatment Facility as reported in BH TEDS Total Requests (Admissions + Expired Requests) # of Expired Requests Reported by the PIHP PIHP A 0 1,334 1,334 0.0% PIHP B 81 2,703 2,784 2.9% PIHP C 82 1,034 1,116 7.3% PIHP D 135 1,076 1,211 11.1% PIHP E 169 1,309 1,478 11.4% PIHP F 83 472 555 15.0% PIHP G 196 789 985 19.9% PIHP H 383 1,264 1,647 23.3% Detroit Wayne Mental Health Authority 851 2,659 3,510 24.2% Region 10 512 1,556 14,196 2,068 16,688 24.8% 14.9% Statewide Total 2,492 18
Time to Treatment Reported in BH-TEDS BHDDA excludes all changes in service category/level of care/setting ( step downs ) in the final calculation. When a PIHP discharges and re-admits to the same licensed provider when there is a change in level of care, the reported Time to Treatment in Days in the subsequent admission is typically zero or one. It s not a measure of organizational performance.It s an artifact that results from this self- imposed, procedural step. Treatment Setting is collected both at admission and at discharge because it can change from start to completion/termination. MDHHS s preferred approach is to admit once and discharge only once at a given provider (identified by LARA License Number). Admitting and discharging when the Level of Care changes is no longer a requirement and fragments the episode of care and should be discontinued. Eight of the ten PIHPs admit and discharge by service category, not following the new guidelines. 19
Next Steps HSAG has begun the performance measure validation (PMV) process mid-June 2021. Evaluate the PIHP s adherence to the performance indicator specifications. Determine where improvements in data collection and reporting are needed. 21
Next Steps Performance improvement initiatives The 2021 Information Systems Capability Assessment (ISCAT) includes the new question Describe any quality improvement interventions or activities your PIHP implemented and/or conducted to improve measure indicator rates. HSAG 2021 Technical Report will include the recommendation for the PIHP to implement a performance improvement initiative related to indicator 2, 2b, or 3. Each PIHP will introduce a performance improvement initiative for 2022 and include as part of the PIHP s 2022 QAPIP. HSAG s 2022 PMV will include PIHP s description of performance improvement initiative. 22
Next Steps Develop Standards for indicator 2a, 2e and 3. Revision to indicators 4a and 4b HSAG 2020 EQR Technical Report includes the recommendation to review the specifications for indicators 4a and 4b. BHDDA will re-convene the performance indicator workgroup to address both of these. 23
Questions? 24
Send questions about MMBPIS to: Kathy Haines hainesk@michigan.gov Phil Chvojka ChvojkaP@michigan.gov Kasi Hunziger hunzigerk@michigan.gov 25