HIV and STI Data Overview in Urban Areas (December 2018)
This data report, updated in December 2018, provides insights into HIV and STI prevalence, viral load suppression, achievement of 90-90-90 goals, and hepatitis B and syphilis seroprevalence among HIV-positive adults in urban areas. The figures and maps illustrate statistics based on the EPHIA 2018 survey, offering valuable information for public health initiatives and interventions.
Download Presentation

Please find below an Image/Link to download the presentation.
The content on the website is provided AS IS for your information and personal use only. It may not be sold, licensed, or shared on other websites without obtaining consent from the author. Download presentation by click this link. If you encounter any issues during the download, it is possible that the publisher has removed the file from their server.
E N D
Presentation Transcript
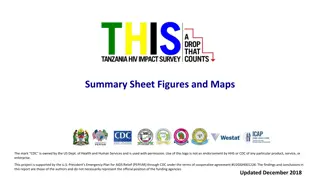
Summary Sheet Figures and Maps Updated December 2018 The mark CDC is owned by the US Dept. of Health and Human Services and is used with permission. Use of this logo is not an endorsement by HHS or CDC of any particular product, service, or enterprise. This project is supported by the U.S. President s Emergency Plan for AIDS Relief (PEPFAR) through CDC under the terms of cooperative agreement #U2GGH001226. The findings and conclusions in this report are those of the authors and do not necessarily represent the official position of the funding agencies
HIV Prevalence by Age and Sex, in Urban Areas, EPHIA 2018 Error bars represent 95% confidence intervals.
HIV Prevalence Among Adults in Urban Areas, by Region, EPHIA 2018
Viral Load Suppression Among HIV-Positive People, by Age and Sex, in Urban Areas, EPHIA 2018 Estimates based on less than 25 observations have been suppressed with an asterisk due to inadequate sample size. Estimates based on 25-49 observations are included in parentheses and should be interpreted with caution. Error bars represent 95% confidence intervals.
Viral Load Suppression Among HIV-Positive Adults in Urban Areas, by Region, EPHIA 2018 Estimates based on less than 25 observations have been suppressed with an asterisk due to inadequate sample size. Estimates based on 25-49 observations are included in parentheses and should be interpreted with caution.
Achievement of the 90-90-90 Goals Among HIV-Positive Adults, by Sex, in Urban Areas, EPHIA 2018 Percentages shown in the graph refer to the conditional 90-90-90 targets Error bars represent 95% confidence intervals.
Seroprevalence of Hepatitis B Surface Antigen Among HIV- Positive Adults, in Urban Areas, EPHIA 2018 Error bars represent 95% confidence intervals.
Syphilis Prevalence Among HIV-Positive Adults, by Sex, in Urban Areas, EPHIA 2018 The percentage of adults ever infected with syphilis includes people with active infection. Participants whose test was reactive only to treponemal antibodies were considered ever infected. Error bars represents 95% confidence intervals
Find the EPHIA Summary Sheet and additional PHIA Project Results at: https://phia.icap.columbia.edu The mark CDC is owned by the US Dept. of Health and Human Services and is used with permission. Use of this logo is not an endorsement by HHS or CDC of any particular product, service, or enterprise. This project is supported by the U.S. President s Emergency Plan for AIDS Relief (PEPFAR) through CDC under the terms of cooperative agreement #U2GGH001226. The findings and conclusions in this report are those of the authors and do not necessarily represent the official position of the funding agencies
