Water Services 2023 Municipalities Report Overview
This report provides a comprehensive overview of the performance of 27 municipalities in their water supply systems in 2023. It highlights positive results such as high supervisor and engineering post fill rates, good infrastructure conditions, and satisfactory water quality compliance. However, it also points out challenges like high non-revenue water levels, operational monitoring issues, and inadequate financial information provision. Recommendations for improvement are outlined based on the key findings.

Download Presentation

Please find below an Image/Link to download the presentation.
The content on the website is provided AS IS for your information and personal use only. It may not be sold, licensed, or shared on other websites without obtaining consent from the author.If you encounter any issues during the download, it is possible that the publisher has removed the file from their server.
You are allowed to download the files provided on this website for personal or commercial use, subject to the condition that they are used lawfully. All files are the property of their respective owners.
The content on the website is provided AS IS for your information and personal use only. It may not be sold, licensed, or shared on other websites without obtaining consent from the author.
E N D
Presentation Transcript
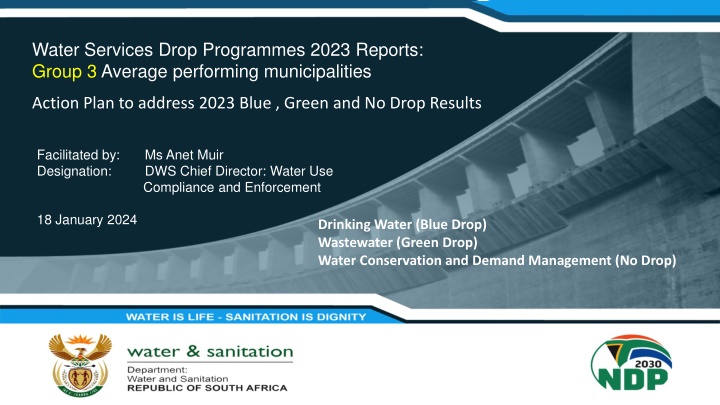
Water Services Drop Programmes 2023 Reports: Group 3 Average performing municipalities PRESENTATION TITLE Action Plan to address 2023 Blue , Green and No Drop Results Presented by: Designation: Directorate: Name Surname Director Communication Services Facilitated by: Designation: Ms Anet Muir DWS Chief Director: Water Use Compliance and Enforcement 18 January 2024 Date: 15 April 2019 Drinking Water (Blue Drop) Wastewater (Green Drop) Water Conservation and Demand Management (No Drop)
Part A: Summary of key results (1) Introduction This group consists of 27 municipalities that scored average across their water supply systems in 2023 full Blue Drop and or 2022 full Green Drop Assessments Key Positive Results Across the 27 municipalities, on average 99% of the required supervisors posts are filled with properly qualified supervisors (Blue Drop); (81% Green Drop) 89% of the required qualified engineering posts across the 27 municipalities are filled Across the 27 municipalities, the average Blue Drop infrastructure condition is 75%. Fifteen of the 27 municipalities scored higher than 80% for Blue Drop infrastructure condition (good or excellent), 11 had infrastructure in an average condition and one had no Technical Site Assessment as it did not have a water treatment works Based on water quality tests carried out by the 27 municipalities in this group during the 2021/2022 municipal financial year, 88% of systems achieved excellent or good, 12% of systems unacceptable chemical water quality compliance 2
Summary of key results (2) Key Negative Results Many of the 27 municipalities had less than average (poor or critical) scores for some of their water supply systems and wastewater systems Of the 27 municipalities, 6 scored poor or critical for 2023 No Drop 22 of the 27 municipalities had NRW of 30% or higher Across the 27 municipalities, the average %NRW is 42% with 10 municipalities having an average higher than 50%. 5 of these 10 municipalities' %NRW is above 60% 17 of the 27 municipalities scored unsatisfactory for operational monitoring Across the 27 municipalities, the average Green Drop infrastructure condition is 68%. Four municipalities had Green Drop Infrastructure in a poor condition Across the 27 municipalities, there is on average a shortfall of 32% of the required properly qualified process controllers (Blue Drop); (35% Green Drop) Shortfall levels of qualified scientists is at 37% Ten of the 27 municipalities are not able to, or are only partially able to, provide the requested financial information e.g operations and maintenance budget, capital budget, percentage expenditure on O&M, asset value 3
Summary of key results (3) Key Negative Results continued Of the 27 municipalities, 23 (85%) are failing to conduct the required compliance monitoring (testing) for wastewater (required by law) Of the 27 municipalities, 17 (63%) are failing to conduct the required tests for drinking water (required by law) Based on water quality tests carried out by the 27 municipalities in this group during the 2021/2022 municipal financial year 45% of systems achieved excellent or good, 55% unacceptable microbiological water quality compliance 13 municipalities failed to issue advisory notices for 103 drinking water systems which did not meet chemical or microbiological water quality standards during testing in this time period this is against the law 4
PART B: Analysis of results The average performing municipalities are well staffed in terms of qualified supervisors and engineers, but have severe shortage of certified process controllers and scientists The shortages of certified process controllers and scientists may partially explain the relatively poor performance of this group of municipalities in terms of compliance monitoring i.e carrying out the required tests, given that generally process controllers are responsible for daily on-site testing Drinking water infrastructure is generally in a good condition. This indicates that non infrastructure factors such as hiring certified process controllers are more important than infrastructure factors in terms of explaining lapses in performance for drinking water The municipalities in this group have relatively high NRW, which in turn indicates ineffective maintenance and management to minimise losses as well as ineffective billing and revenue collection systems The relatively poor condition of wastewater infrastructure is an indication of a lack of prioritisation of maintenance of wastewater infrastructure in particular 5
PART C: LESSONS TO BE LEARNT FROM MUNICIPALITIES THAT SCORED GOOD OR EXCELLENT Key positive results of the 12 Good or Excellent performing municipalities Across the twelve municipalities, on average 80% of the required process controller posts are filled with properly qualified process controllers (Blue Drop); (92% Green Drop) Across the twelve municipalities, on average 98% of the required supervisors posts are filled with properly qualified supervisors (Blue Drop); (96% Green Drop) Shortfall levels of qualified scientists and engineers are also extremely low across all the 12 municipalities Of the 12 municipalities, 9 (75%) are regularly carrying out the required tests for drinking water (same for wastewater) These 12 municipalities are able to provide almost all the requested financial information e.g. operations and maintenance budget, capital budget, percentage expenditure on O&M, asset value Across the 12 municipalities, the average Blue Drop infrastructure condition is 85% (81% for Green Drop). Eleven of the 12 municipalities scored higher than 80% for Blue Drop infrastructure condition (good or excellent) - one had infrastructure in an average condition); (8 for Green Drop) Across the 12 municipalities, the average NRW is 29% Across the 12 municipalities there is a 100% excellent compliance with chemical standards for drinking water quality Across the 12 municipalities there is 91% good or excellent compliance with microbiological standards for drinking water 6
LESSONS TO BE LEARNT FROM MUNICIPALITIES THAT SCORED GOOD OR EXCELLENT (2) The results indicate that the best performing municipalities generally: o Have adequate staff with the right qualifications o Keep their infrastructure in a well-maintained condition o Have relatively low NRW, which in turn indicates effective maintenance and management to minimise losses as well as effective billing and revenue collection systems o Have effective compliance and operational monitoring systems, i.e. they carry out required water quality tests and ensure that proper processes are followed o Have effective financial and asset management systems in place and are able to accurately report on their budgets and expenditure and assets 7
PART C: Additional actions to be taken DWS to increase awareness of assistance available of registration of plant and Process Controllers over the next 3 months All Municipalities to ensure registration of plant, Process Controllers and upload monitoring data on IRIS with DWS support within 6 months WSA to assess their compliance against the new Regulations 3630 on classification of works and Process Controller registration and ensure compliance by 26 June 2025 Where under performance against KPAs are identified in BD, GD and ND reports these must be listed in the risk registers and discussed in Risk Management and Council meetings within 2 months Provincial Offices of DWS and Municipalities must also engage the media and Public about individual BD, GD & ND results to ensure they are well understood over the next 2 months National Treasury to renew the Local Governments fiscal framework, including the financial viability of Municipalities and water services with high percentages of indigent population WSA to plan to recruit Supervisors, Engineers, Process Controllers & Scientists to replace the aging workforce (ongoing) 8
PART C: Additional actions to be taken WSA to partner with private sector and civil society where possible and feasible to improve service delivery and to protect infrastructure (e.g. PPP, collaboration with Industry) supported by the Strategic Water Sector Partnership Network and Water Partnership Office (ongoing) CoGTA, DWS & DHS to increase awareness of what the MIG and other Infrastructure Grant can fund within 6 months WSAs should plan to invest a portion of revenue for Infrastructure renewal National Government should implement an awareness campaign to address the culture on non-payments for water services over the next 3 months WSAs should also engage with their communities to address non-payment (ongoing) WSAs must focus on upskilling of existing staff with support of training bodies WSAs to consider long-term planning (20y) WSA to assess possibility of obtaining direct feed from Eskom for their water and sanitation infrastructure to enable exemption from loadshedding DWS commits to continue with BD, GD & ND 9
Annexure : List of Municipalities Nelson Mandela MM City of Johannesburg Buffalo City LM City of Tshwane Lesedi LM Midvaal LM Mogale City LM eThekwini MM iLembe DM Newcastle LM Msunduzi LM* uMhlathuze LM Dawid Kruiper LM Bergrivier LM Cape Agulhas LM George LM Amatole DM Harry Gwala DM Mbombela/Umjindi Mkhondo LM Nkomazi LM Steve Tshwete LM Rustenburg LM Beaufort West LM Breede Valley LM Knysna LM Stellenbosch LM 10

")
")
")