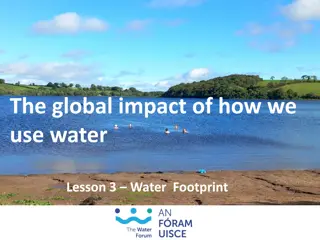
Water Matters: A Closer Look at Environmental Impact
Water is a vital resource that sustains life, yet its misuse and pollution pose significant threats. Explore key statistics on water consumption, freshwater habitats, and the impact of abandoned mines on water quality. Discover the importance of preserving this essential resource for a sustainable future.

Download Presentation

Please find below an Image/Link to download the presentation.
The content on the website is provided AS IS for your information and personal use only. It may not be sold, licensed, or shared on other websites without obtaining consent from the author.If you encounter any issues during the download, it is possible that the publisher has removed the file from their server.
You are allowed to download the files provided on this website for personal or commercial use, subject to the condition that they are used lawfully. All files are the property of their respective owners.
The content on the website is provided AS IS for your information and personal use only. It may not be sold, licensed, or shared on other websites without obtaining consent from the author.
E N D
Presentation Transcript
Infographic template This template has been designed to enable staff to create on brand infographics. All text fields and graphics have been populated in the following slides to show a working example, therefore please amend the title, introduction statement, stats and supporting text to suit. Please keep the layout, graphics and colours as they are some of this is important to retain adequate accessibility. Choose your preferred slide: slides 2-7 provide options for a set of 8 stats, whereas slides 8-13 are for a set of 6 stats. Slides 14 to 19 contain various on brand icons that you can copy and paste on to the slide you are editing. The Environment Agency brand colours used for the text and images are: Green2 (RGB value of 0/175/65) Blue2 (RGB value of 3/75/137) For date and source references use this format: To export your infographic for use on social media, please choose: Save As > Save as type: PNG Portable Network Graphics Format. The template size has been optimised for Twitter, and a PNG format will ensure that your infographic looks the best quality. If you have any questions regarding the use of this template please contact Sam Jolly in the Delivery Team (020 302 54708) Data correct as of --/--/2018 Updated 25/09/2018
Why water matters?. 140 Litres/day 100% the average water use per person per day of life depends on water 39.5 billion 12% of land cover in the UK is freshwater habitat the monetary value of UK freshwaters 16% 90% of the UK s wetland habitats have been lost in the last 100 years of England s groundwater, rivers, lakes, estuaries and seas are close to their natural state
ECONSULTATION READY: Why water matters?. 140 Litres/day 100% of life depends on water the average water use per person per day 39.5 billion 12% the monetary value of UK freshwaters of land cover in the UK is freshwater habitat 16% 90% of England s groundwater, rivers, lakes, estuaries and seas are close to their natural state of the UK s wetland habitats have been lost in the last 100 years
Abandoned mines Over Up to 50% Whats the problem ? 1,500 km of the metals found in our rivers today come from abandoned metal mines the length of water bodies impacted by abandoned mine pollution 50% Over 100 km 500,000 Whats being done the number of people whose drinking water supply is protected each year by the 44 coal mine water treatment plants of river improved towards good status since the 2015 150 million 750 km What outcomes are being achieved ? of planned environmental and economic benefits to be delivered by 2027 of rivers polluted by mines are targeted to improve by 2027
Abandoned mines Over Up to 50% Graphic showing that over 1,500 km of water bodies are impacted by abandoned mine pollution. Graphic also shows that up to 50% of the metals found in our rivers today come from abandoned metal mines 1,500 km the length of water bodies impacted by abandoned mine pollution of the metals found in our rivers today come from abandoned metal mines Over 100 km Graphic showing that over 100km of rivers improved towards good status since the 2015 river basin management plans. Graphic also shows that 500,000 people s drinking water supply is protected each year by the 44 coal mine water treatment plans 500,000 the number of people whose drinking water supply is protected each year by the 44 coal mine water treatment plants of river improved towards good status since the 2015 Graphic showing that over 750km of rivers polluted by mines are targeted to improve by 2027. Graphic also shows that 150 million of environmental and economics are planned to be delivered by 2027 150 million 750 km of planned environmental and economic benefits to be delivered by 2027 of rivers polluted by mines are targeted to improve by 2027
Physical modification 6000 yrs 41% Whats the problem ? We have altered and modified our waters and landscapes for over 6000 years we continue to do so today of water bodies are not meeting their ecological targets due to impacts from physical modifications 50% 4,483 km 68 million 68 million 68 million of our water environment has been enhanced since January 2016. However, despite significant efforts the overall impact from physical modifications appears unchanged Whats being done of government funding was spent between 2009 and 2015 on measures to remove and improve some of the physical modifications Coastal and estuarine Inland waters Keep soil on land and out of the water Improve new developments and activities Improve new developments and activities Retain sediment COASTAL CELL CATCHMENT Priority actions in our catchments and coasts will reduce pressures from physical modifications and help manage climate change What outcomes are being achieved ? HINTERLAND FLOODPLAIN INTER- TIDAL CHANNEL Remove redundant structures and modifications Remove redundant structures and modifications Make room for coastal adjustment Provide space for rivers to move and adjust
Physical modification 6000 yrs 41% We have altered and modified our waters and landscapes for over 6000 years we continue to do so today. of water bodies are not meeting their ecological targets due to impacts from physical modifications 68 million 4,483 km of government funding was spent between 2009 and 2015 on measures to remove and improve some of the physical modifications of our water environment has been enhanced since January 2016. However, despite significant efforts the overall impact from physical modifications appears unchanged
Priority actions in our catchments and coasts will reduce pressures from physical modifications and help manage climate change Inland waters Keep soil on land and out of the water Improve new developments and activities CATCHMENT Alt text Graphic shows the priority actions in our catchments and coasts will reduce pressures from physical modifications and help manage climate change FLOODPLAIN CHANNEL Provide space for rivers to move and adjust Remove redundant structures and modifications Coastal and estuarine Improve new developments and activities Retain sediment COASTAL CELL HINTERLAND INTER- TIDAL Remove redundant structures and modifications Make room for coastal adjustment
Chemicals 36% 56% What s the problem ? of the pesticides monitored for, that are in current usage, have been detected in Catchment Sensitive Farming rivers above a threshold value of 0.1 ug/l on at least one occasion since 2014 of sampled sites exceeded two or more biota Environmental Quality Standards in freshwater fish between 2014 and 2018 What s being done 4of 5 503 separate chemical measures in the 2020 to 2025 water company plans, with an anticipated cost of 200m pesticides used on oilseed rape have decreased in frequency of detection and concentration in water as a result of voluntary initiatives What outcomes are being achieved ? Over 30% 154 decline in levels of certain brominated flame retardants discharged from wastewater treatment works between 2013 and 2016 number of Safeguard Zones in place protecting our drinking water resources from chemicals
Chemicals Alt Text Graphic showing that 56% of sampled sites exceeded two or more biota Environmental Quality Standards in freshwater fish between 2014 and 2018. Graphic also shows 36% of 141 pesticides in current usage have been found above 0.1 g/l on at least one occasion in monitored rivers 36% 56% of the pesticides monitored for, that are in current usage, have been detected in Catchment Sensitive Farming rivers above a threshold value of 0.1 ug/l on at least one occasion since 2014 4of 5 of sampled sites exceeded two or more biota Environmental Quality Standards in freshwater fish between 2014 and 2018 Alt Text Graphic shows there are 503 separate chemical measures in the 2020 to 2025 Water Industry National Environment Programme, with anticipated cost of 200m. Graphic also shows that 4 of 5 pesticides used on oilseed rape have decreased in frequency of detection and concentration in water as a result of voluntary initiatives 503 separate chemical measures in the 2020 to 2025 water company plans, with an anticipated cost of 200m pesticides used on oilseed rape have decreased in frequency of detection and concentration in water as a result of voluntary initiatives Alt Text Graphic shows an over 30% decline in levels of certain brominated flame retardants discharged from wastewater treatment works between 2013 and 2016. Graphic also shows there are 154 Safeguard zones in place protecting our drinking water resources from chemicals. Over 30% 154 decline in levels of certain brominated flame retardants discharged from wastewater treatment works between 2013 and 2016 number of Safeguard Zones in place protecting our drinking water resources from chemicals