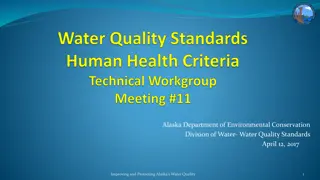
Water & Health in Alaska
Addressing the importance of water quantity for optimal health in Alaska, focusing on documented health benefits, waterborne diseases, and guidelines for water usage. The impact of piped water on infection rates and opportunities for observation in different household water use scenarios are also explored.

Download Presentation

Please find below an Image/Link to download the presentation.
The content on the website is provided AS IS for your information and personal use only. It may not be sold, licensed, or shared on other websites without obtaining consent from the author. If you encounter any issues during the download, it is possible that the publisher has removed the file from their server.
You are allowed to download the files provided on this website for personal or commercial use, subject to the condition that they are used lawfully. All files are the property of their respective owners.
The content on the website is provided AS IS for your information and personal use only. It may not be sold, licensed, or shared on other websites without obtaining consent from the author.
E N D
Presentation Transcript
Water & Health in Alaska considerations for water quantity Troy Ritter, REHS, MPH, DAAS Applied Sciences Manager ANTHC-DEHE
Documented health benefits of improved water service in Alaska Acute respiratory infections Skin infections Invasive pneumococcal disease
Bradley Classifications Waterborne diseases: where the pathogen is in the water and causes illness when ingested Water-washed diseases: where transmission of the pathogen is interrupted by washing with water
How much water is needed for optimal health?
Water Quantity Guidelines With internal fixtures The World Health Organization4: 26.4 Cold Regions Utilities Monograph5: 15.9 No internal fixtures Gleick3: 13.2 The World Health Organization8: 13.2 The Sphere Project6: 4 The UN Refugee Agency7: 4-5 *All units are gallons/person/day
How much water is needed for optimal health (in Alaska)?
Impact of piped water on rates of infections Start with 4 villages with only self haul water Collected data on water use and health Most households were proved piped services Collect data on water use and health after pipes
Opportunities for Observation 1. 2. 3. Water use in self-haul households Water use in piped households Water use in transition from self-haul to piped
Water use in self-haul households Residential water use < 2 gpcpd
Change in Household Water Use (volume) 35 Gallons of Water Used/per person/per Village A 30 Mean Water Use 25 20 Predicted Water Use day 15 Self-haul Water Use 10 5 Self-haul Water Use 0 0 5 10 15 20 25 30 Time Since Start of Water Promotion Project (months)
Change in Soap Use (volume) 14 Soap Use in Village A 12 Soap Use Per Person Per Day 10 8 6 4 Self-haul use 2 0 1 4 7 10 13 16 19 22 25 28 31 Months Since Start of Project
Comments about water use "When our kids come in dirty we just put them in the bath. It's really easy we don't have to heat water for the bath. You can take shower anytime. "With the potable water, you can wash your hands more frequently." "We don't have to wash hands in the same water. "Cleaner kids. Cleaner house. Our family doesn't get sick that often. "People have readily available water to wash hands and dishes." You can wash your hands. You have water all the time. Dishes are done whenever they need to be. "Has been nice to be able to wash everyday"
Change in (piped) Water Use by Village Mean Water Use Per Household 60 Gallons of Water Use/per person/per day 50 40 Village A Village B 30 Village C 20 Village D Self-haul Water Use 10 0 0 5 10 15 20 25 30 Time Since Start of Water Promotion Project (months)
What about small vehicle haul systems?
Self-haul vs. Small haul Water use in self-haul households Water use in small-haul households Residential water use < 2 gpcpd Residential water use < 2 gpcpd
Promoting healthy water use through education
You can teach a dog to swim but you cant teach a dog to snorkel - Calie Ritter, age 6
Recommendations for optimal health There s no magic number . Water use needs are specific to the system and population. Optimal health is achieved through an integrated approach that includes provision of infrastructure, proper O&M and education to encourage healthy water use behaviors. Water service must be affordable in order to provide a health benefit. User fees should be independent of water use.
References 1. Brundin, I., & Hennessey, T. (2011). Literature review of water quantity standard for optimal health in arctic regions. Eichelberger, L. P. (2010). Living in utility scarcity: energy and water insecurity in northwest Alaska. Am Journal of Public Health, 100(6):1010-18. 3. 4. 5. Gleick, P. (1996). Basic water requirements for human activities: Meeting basic needs. Water International, 21:83-92. Howard, G. & Bartram, J. (2003). Domestic Water Quantity, Service Level and Health, World Health Organization. Retrieved January 20, 2012 from http://www.who.int/water_sanitation_health/diseases/WSH03.02.pdf Smith, D.W. (Ed.). (1996). Cold Regions Utilities Monograph, (3ed Ed.). New York, NY: American Society of Civil Engineers. The Sphere Project. (2011). Minimum standards in water supply, sanitation and hygiene promotion. In The Sphere Project Handbook, (pp 79-137). Rugby, UK: Practical Action Publishing. Retrieved January 18, 2012 from http://www.your-brochure- online.co.uk/sphere_handbook_english_2011/html/ UNHCR. (1992). Water Manual for Refugee Situations. Retrieved January 18, 2011 from http://www.unhcr.org/3ae6bd100.html World Health Organization. (2010). Minimum water quantity neededfor domestic use in emergencies.Retrieved January 18, 2012 http://www.who.int/water_sanitation_health/hygiene/envsan/minimumquantity.pdf 2. 3. 4. 5. 6. 7. 8.
Hierarchy of Water Requirements (after Maslow s hierarchy of needs) Drinking Cooking Increasing Quantity Personal Washing Zone of Water-Washed Infection Washing Clothes Cleaning Home Waste Disposal Non-Residential


")
")
")

 Water Use by Village")