Voltammetry: Principles and Applications

Voltammetry
General Principles of
Voltammetry
•
In voltammetry
current (
I
)
is measured as a function of changing
potential (
E
)
•
As potential is applied, electrolysis of analyte begins and current rises
until it reaches a limiting current


•
The magnitude of this current is directly proportional to activity or
concentration of analyte i.e
I
=
kC
•
Where
I
= current,
k
= constant,
C
= concentration of analyte
•
E
1/2
= half wave potential (characteristic of every redox reaction)
•
Plot of
I
vs.
E
is called a
voltammogram

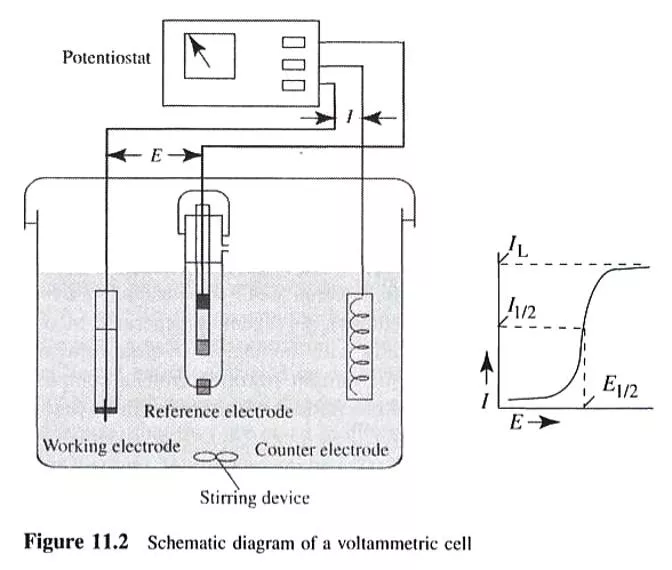
Voltametric Cell
•
Electrolytic cell consisting of 3 electrodes:
–
Micro indicator electrode
like
Hg, Pt, Au, Ag, C or others
–
Reference electrode
like
SCE or Ag/ AgCl
–
Auxillary counter electrode
like
Pt wire
Typical 3-electrode
Voltammetry cell
Counter
electrode
Reference electrode
Working electrode
End of Working electrode
O
R
O
R
e
-
Bulk solution
Mass transport
Reduction at electrode
Causes current flow in
External circuit
Voltametric Cell
•
Changing potential (E) is applied on the
indicator electrode (working
electrode)
to drive a nonspontaneous redox reaction
•
Counter electrode
serves to conduct electricity between the two
electrodes
•
Reference electrode
has a constant potential throughout
•
A
supporting electrolyte
is a salt added in excess to the analyte solution.
Most commonly, it is an alkali metal salt that does not react at the
working electrode at the potentials being used. The salt reduces the
effects of
migration
and
lowers the resistance
of the solution.
Three electrode cell:
Working
Reference
Counter/auxilliary
current flows between
working and counter
electrodes.
Potential controlled by
potentiostat between
working and reference
electrodes.
I
n
f
l
u
e
n
c
e
o
f
a
p
p
l
i
e
d
p
o
t
e
n
t
i
a
l
o
n
t
h
e
f
a
r
a
d
a
i
c
c
u
r
r
e
n
t
•
When the potential applied to the working electrode
reaches to the reduction potential of the electroactive
species, a reduction will take place at the electrode surface
•
Thus, electroactive species
diffuses
from the bulk solution to
the electrode surface and the reduction products diffuse
from the electrode surface towards the bulk solution. This
creates what is called the faradaic current.
-0.2
-0.4
-0.6
-0.8
-1.0
-1.2
-1.4
i
(
A)
0.001 M Cd
2+
in 0.1 M KNO
3
supporting electrolyte
V vs SCE
i
d
E
½
Base line
of residual
current
C
u
r
r
e
n
t
i
n
V
o
l
t
a
m
m
e
t
r
y
•
When an analyte is oxidized at the working electrode, a
current passes electrons through the external electric
circuitry to the auxiliary electrode.
•
This current flows from the auxiliary to the working
electrode, where reduction of the solvent or other
components of the solution matrix occurs .
•
The current resulting from redox reactions at the working
and auxiliary electrodes is called a
faradaic current.
•
Sign Conventions A current due to the analyte's reduction is
called a
cathodic
current and, by convention, is considered
positive
.
Anodic
currents are due to oxidation reactions and
carry a
negative
value.
•
The magnitude of the faradaic current is
determined by the rate of the resulting oxidation or
reduction reaction at the electrode surface.
•
Two factors contribute to the rate of the
electrochemical reaction:
–
the rate at which the reactants and products are
transported to and from the surface of the
electrode (
mass transport
)
–
and the rate at which electrons pass between the
electrode and the reactants and products in the
solution. (
kinetics of electron transfer at the
electrode surface
)
Influence of Mass Transport on the Faradaic Current
There are three modes of mass transport to and from the electrode
surface: diffusion, migration, and convection.
•
Diffusion
from a region of high concentration to a region of low
concentration occurs whenever the concentration of an ion or
molecule at the surface of the electrode is different from that in bulk
solution.
•
Convection
occurs when a mechanical means is used to carry
reactants toward the electrode and to remove products from the
electrode.
–
The most common means of convection is to stir the solution
using a stir bar. Other methods include rotating the electrode and
incorporating the electrode into a flow cell.
•
Migration
occurs when charged particles in solution are attracted or
repelled from an electrode that has a positive or negative surface
charge.
–
Unlike diffusion and convection, migration only affects the mass
transport of charged particles
•
diffusion
is the only significant means for the mass transport
of the reactants and products, the current in a voltammetric
cell is given by
where
n is
the number of electrons transferred in the redox
reaction, F is Faraday's constant, A is the area of the electrode,
D
is the diffusion coefficient for the reactant or product, C
buIk
and C
x=o
are the concentration of the analyte in bulk solution
and at the electrode surface, and
is the thickness of the
diffusion layer.
Diffusion current
: I
d
is directly proportional to the
concentration of the analyte.
I
d
= limiting current – residual current
[C]
o
Ilkovic equation
I
n
f
l
u
e
n
c
e
o
f
t
h
e
K
i
n
e
t
i
c
s
o
f
E
l
e
c
t
r
o
n
T
r
a
n
s
f
e
r
o
n
t
h
e
F
a
r
a
d
a
i
c
C
u
r
r
e
n
t
•
When electron transfer kinetics at the electrode surface are
fast
, the redox reaction is at
equilibrium
, and the
concentrations of reactants and products at the electrode
are those specified by the Nernst equation.
•
Such systems are considered electrochemically
reversible
.
•
In other systems, when electron transfer kinetics are
sufficiently slow,
the concentration of reactants and
products at the electrode surface, and thus the current
,
differ from that predicted by the Nernst equation. In this
case the system is electrochemically
irreversible
.
N
o
n
f
a
r
a
d
a
i
e
C
u
r
r
e
n
t
s
•
Currents other than faradaic may also exist in an
electrochemical cell that are unrelated to any redox reaction.
•
These currents are called
nonfaradaic currents
•
The most important example of a nonfaradaic current occurs
whenever the electrode's potential is changed.
•
When mass transport takes place by
migration
negatively
charged particles in solution migrate toward a positively
charged electrode, and positively charged particles move away
from the same electrode.
•
When an inert electrolyte is responsible for migration, the
result is a structured electrode‑surface interface called the
electrical double layer
, or EDL,
•
The movement of charged particles in solution, gives rise to a
short‑lived,
nonfaradaic charging current
.
•
Changing the potential of an electrode
•
causes a change in the structure of
•
the EDL, producing a small charging current.
R
e
s
i
d
u
a
l
C
u
r
r
e
n
t
•
Even in the absence of analyte, a small current flows through
an electrochemical cell.
•
This current, which is called the residual current, consists of
two components:
–
a
faradaic current
due to the oxidation or reduction of trace
impurities,
–
a
charging current
. it is the current needed to charge or
discharge the capacitor formed by the electrode
surface‑solution interface. This is called the condenser
current or charging current.
–
It is present in all voltammetric
and polarographic experiments,
regardless of the purity of reagents.
Types of Voltammetry
Different kinds of
Voltammetry
•
Polarography
•
Linear sweep and Cyclic Voltammetry
•
Hydrodynamic Voltammetry
•
Pulsed methods
•
Stripping Voltammetry
•
AC Voltammetry
P
o
l
a
r
o
g
r
a
p
h
y
•
Jaroslav Heyrovský
was the inventor of the polarographic
method, and the father of electroanalytical chemistry, for which
he was the recipient of the Nobel Prize. His contribution to
electroanalytical chemistry can not be overestimated. All modern
voltammetric methods used now in electroanalytical chemistry
originate from polarography.
•
In polarography the working electrode is a
dropping mercury
electrode (DME)
or a mercury droplet suspended from a bottom
of a glass capillary tube.
•
Analyte is either
reduced
(most of the cases) or
oxidized
at the
surface of the mercury drop.
•
The current –carrier auxiliary electrode is a platinum wire.
•
SCE or Ag/AgCl reference electrode is used.
•
The potential of the mercury drop is measured with respect to
the reference electrode.
The
DME
is referred to as the
working or indicator electrode, it is
made up of
mercury reservoir
connected to a
capillary tube
. The
capillary tube deliver mercury size of
about 1mm in diameter
(micro-electrode), the mercury
drops every two seconds and as
such a
fresh surface of mercury
is
encountered such that the reaction
at any point in time does not
depend on the past history
of
the electrode. This therefore, makes
the electrode reaction perfectly
reproducible
. Also since it is
a micro electrode, the amount of
current carried is very low (0-15UA).
T
y
p
i
c
a
l
e
l
e
c
t
r
o
c
h
e
m
i
c
a
l
c
e
l
l
u
s
e
d
i
n
p
o
l
a
r
o
g
r
a
p
h
y
Advantages and Disadvantages of the Dropping Mercury Electrode
Some of the advantages of dropping mercury electrode(DME) are as follows
:
Mercury form amalgam with most metals.
Mercury has a high hydrogen overvoltage.
It provides a smooth, fresh surface for the reaction.
Each drop remains unaffected and does not become contaminated by the
deposited metal.
Diffusion equilibrium is readily established at mercury-solution interface.
Some of the disadvantages of dropping mercury electrode(DME) are as follows:
It is poisonous so care should be taken in its handling.
Surface area of a drop of mercury is never constant.
Applied voltage produces changes in surface tension and hence change in
drop size.
Mercury has limited applications in analysis of more positive potential
range.
Following care must be taken while using dropping mercury electrode:
Pure and triple distilled mercury should be used in DME
Tip of DME should be always immersed in water when not in use.
Tip of DME should be cleaned by dipping in nitric acid.
The DME assembly should be mounted vertical on a heavy stand to be free
from vibrations.
It is essential to use clean and dust free tubing while setting the DME.
There should be sufficient mercury in reservoir so that the pressure changes
are negligible.
21
•
One serious
limitation of the dropping electrode
is
the ease with which mercury is oxidized: this
property severely limits the use of the electrode as
an anode. At potentials greater than about + 0.4 V,
formation of mercury(I) gives a wave that masks
the curves of other oxidizable species.
•
In the presence of ions that form precipitates or
complexes with mercury(I), this behavior occurs
at even lower potentials. For example, in the
Figure, the beginning of an anodic wave can be
seen at 0 V due to the reaction
•
2Hg + 2CI
-
< === > Hg
2
CI
2
(s) + 2e
-
•
Incidentally, this anodic wave can be used for the
determination of chloride ion.
23
•
Another important disadvantage of the dropping
mercury electrode is the nonfaradaic residual or
charging current, which limits the sensitivity of the
classical method to concentrations of about 10
-5
M.
•
At lower concentrations, the residual current is
likely to be greater than the diffusion current, a
situation that prohibits accurate measurement of
the latter.
•
Finally, the dropping mercury electrode is
cumbersome to use and tends to malfunction as a
result of clogging.
Polarography uses mercury droplet
electrode that is regularly renewed
during analysis.
Applications:
Metal ions (especially heavy metal
pollutants) - high sensitivity.
Organic species able to be oxidized
or reduced at electrodes: quinones,
reducing sugars and derivatives, thiol
and disulphide compounds, oxidation
cofactors (coenzymes etc), vitamins,
pharmaceuticals.
Alternative when spectroscopic
methods fail.
S
H
A
P
E
O
F
T
H
E
P
O
L
A
R
O
G
R
A
M
A graph of current versus potential in a polarographic experiment
is called a
polarogram
.
C
d
2
+
+
2
e
C
d
Features of the Polarogram
•
residual current
– the small current before the potential at which
the analyte reacts, caused by reactive species in the matrix and by
the mercury drop behaving like a capacitor
•
limiting current
– the maximum current reached
•
diffusion current
– the difference between the limiting and
residual, and proportional to the concentration of analyte
•
half-wave potential
– the potential half-way up the polarographic
wave, which is similar to the reduction/oxidation potential, and
characteristic of the species;
•
current oscillations
– caused by the mercury drop which
repeatedly falls off and is replenished from the capillary
Polarographic Mechanism
•
When the potential is only slightly negative with respect to the
calomel electrode, essentially no reduction of Cd
2+
occurs. Only a
small residual current flows.
•
At a sufficiently negative potential, reduction of Cd
2+
commences
and the current increases. The reduced Cd dissolves in the Hg to
form an amalgam.
•
After a steep increase in current, concentration polarization sets
in: The rate of electron transfer becomes limited by the rate at
which Cd
2+
can diffuse from bulk solution to the surface of the
electrode.
•
T
h
e
m
a
g
n
i
t
u
d
e
o
f
t
h
i
s
d
i
f
f
u
s
i
o
n
c
u
r
r
e
n
t
I
d
i
s
p
r
o
p
o
r
t
i
o
n
a
l
t
o
C
d
2
+
c
o
n
c
e
n
t
r
a
t
i
o
n
a
n
d
i
s
u
s
e
d
f
o
r
q
u
a
n
t
i
t
a
t
i
v
e
a
n
a
l
y
s
i
s
.
T
h
e
u
p
p
e
r
t
r
a
c
e
i
n
t
h
e
F
i
g
u
r
e
a
b
o
v
e
i
s
c
a
l
l
e
d
a
p
o
l
a
r
o
g
r
a
p
h
i
c
w
a
v
e
.
•
The oscillating current in the Figure above is due to the growth
and fall of the Hg drops.
•
As the drop grows, its area increases, more solute can reach the
surface in a given time, and more current flows.
•
The current increases as the drop grows until, finally, the drop falls
off and the current decreases sharply.
•
Current
or
rate of diffusion
[C]
o
- [C]
s
The [C]
o
and [C]
s
are the concentrations in the bulk
solution and at the electrode surface.
•
The greater the difference in concentrations the
more rapid will be the diffusion.
•
At a sufficiently negative potential, the reduction is
so fast that the [C]
s
<< [C]
o
and equation above
reduces to the form
•
Limiting current = diffusion current
[C]
o
•
The ratio of the diffusion current to the bulk solute
concentration is the basis for the use of
voltammetry in analytical chemistry
•
The magnitude of the diffusion current, is given by the
Ilkovic equation
:
•
l
d
= (7.08 x 10
4
)nCD
1/2
m
2/3
t
1/6
•
where I
d
= diffusion current, measured at the top of the
oscillations in the Figure above with the units µA
•
n = number of electrons per molecule involved in the
oxidation or reduction of the electroactive species.
•
C = concentration of electroactive species, with the units
mmol/L
•
D = diffusion coefficient of electroactive species, with the
units M
2
/s
•
m =rate of flow of Hg, in mg/s
•
t = drop interval, in s
•
The number 7.08 x 10
4
is a combination of several constants
whose dimensions are such that l
d
will be given in , µA
•
Thus, i
d
is proportional to the concentration of a certain species
under specific conditions and the above equation may be
expressed as follows:
i
d
= kc
•
where k is constant under the specific conditions.
•
If k is constant for a series of standard solutions of various
concentrations and an unknown, a calibration plot can be
constructed and the unknown concentration can be determined.
•
Clearly, the magnitude of the diffusion current depends on
several factors in addition to analyte concentration.
•
In quantitative polarography, it is important to control the
temperature within a few tenths of a degree.
•
The transport of solute to the electrode should be made to occur
only by diffusion (
no stirring
).
H
a
l
f
-
w
a
v
e
P
o
t
e
n
t
i
a
l
,
E
1
/
2
•
Half wave potential, E
1/2
is an important feature can
be derived from the plarogram.
•
It is the potential corresponding to one half the
limiting current i.e. i
d
/2.
•
E
l/2
is a characteristic for each element and thus
used for
qualitative analysis
.
S
u
p
p
o
r
t
i
n
g
e
l
e
c
t
r
o
l
y
t
e
•
Current flow due to electrostatic attraction (or
repulsion) of analyte ions by the electrode is reduced to
a negligible level by the presence of a high
concentration of supporting electrolyte (1 M HCl in the
Figure above).
•
Increasing concentrations of electrolyte reduces the net
current, since the rate of arrival of cationic analyte at
the negative Hg surface is decreased.
•
Typically, a supporting electrolyte concentration 50‑100
times greater than the analyte
concentration will reduce electrostatic transport of the
analyte to a negligible level.
E
f
f
e
c
t
o
f
D
i
s
s
o
l
v
e
d
O
x
y
g
e
n
•
Oxygen dissolved in the solution will be reduced at the DME
leading to two well defined waves which were attributed to
the following reactions:
•
O
2
(g) + 2H
+
+ 2e
-
< ==== > H
2
O
2
;
E
1/2
= - 0.1V
•
H
2
O
2
+ 2H
+
+2e
-
< ==== > 2H
2
O;
E
1/2
= - 0.9V
•
E
1/2
values for these reductions in acid solution correspond
to -0.05V and -0.8V versus SCE.
•
This indicates that dissolved oxygen interferes in the
determination of most metal ions.
•
Therefore, dissolved O
2
has to be removed by bubbling
nitrogen free oxygen into the solution before recording the
polarogram.
Current maxima
A distortion of the polarographic wave appears to be due
to absorption phenomena at the surface of the mercury
drop.
The maxima may be
removed by the addition of
surface active agent
(
maxima suppressors
) such
as gelatine, methyl cellulose
or Triton X-100.
Types of PolarograpicTechniques
Linear Sweep polarography or Direct Current (DC) polarography
•
The earliest voltammetric experiment was normal
polarography at a dropping mercury electrode. In normal
polarography the potential is linearly scanned, producing
Polarogram
. In LSV the major source of noise at low
concentration is the
capacitive current
resulting from charging
of electrical double layer at the electrode which limit the
application of this technique to 10
-5
M
Pulse polarography
By using pulse or differential pulse polarography, most of the
capacitive current can be eliminated with a resultant of increase in
the S/N ratio of about 100.
In pulse and differential pulse polarography advantage is taken of
the relatively rapid decrease in the capacitive current as compared
with faradic current after application of a potential to an electrode.
In pulse polarography a
potential pulse is applied to the mercury
drop about 57ms prior to the drops fall from the capillary
.
The capacitive current exponential decays to nearly zero during the
first
40ms of the pulse
and the remaining faradic current is
measured during the
last 17ms of the pulse
.
A drop knocker is used to control time and to permit application of
the pulse just before the drop is knocked from the capillary.
It increase the sensitivity and the detection limits that are about 10
times lower then with low current.
Differential Pulse Polarography
•
In differential pulse polarography, the current is typically
measured
during the 17ms prior to the application of the pulse
and during the last 17ms of application of the pulse and after decay
of the capacitive current
. The polarogram is a plot of the difference
between the two currents as a function of the linearly increasing
voltage.
•
The drop is then mechanically dislodged.
•
The current is not measured continuously
. Rather, it is measured
once
before the pulse and again for the last 17 ms of the p
ulse.
•
The polarograph subtracts the first current from the second and
plots this difference versus the applied potential (measured just
before the voltage pulse).
•
The resulting differential pulse polarogram is nearly the derivative
of a direct current polarogram, as shown in the Figure
•
Again we have
decreased the charging current and increased the
faradaic current
. Generally, detection limits with differential pulse
polarography are two to three orders of magnitude lower than
those for classical polarography and lies in the range of 10
-7
to 10
-8
M.
Polarogram for a differential
pulse polarography experiment.
Here
i
=
i
s2
–
i
s1
. The peak
potential, E
peak
, is colsely
related to the polarographic
half-wave potential.
Square-wave polarography
.
This is the same as the differential pulse method except we do not have
a continuous ramp of voltage but instead the potential is stepped as in
the picture.
The size of the pulses is such that the material reduced in the forward
pulse is oxidized in the reverse pulse. So we have little net consumption
of analyte. The detection limit for square-wave polarography is about
the same as for differential pulse – about 10
-7
to 10
-8
M.
The advantage of the square-wave approach is the speed of the
measurement. With steps in the microseconds, an entire polarogram can
be obtained in 10 msec. The entire scan can be performed in the last
few msecs of the life of a single drop of mercury, when the charging
current is essential zero.
The speed of the measurement also permits increase in precision by
signal averaging data from a number of polarographic scans.
S
q
u
a
r
e
w
a
v
e
p
o
l
a
r
o
g
r
a
p
h
y
Square wave polarography is more sensitive and much faster than
differential pulse polarography. The square wave is also better at rejecting
background signals such as those generated by reduction of oxygen.
Waveform for square wave polarography.
Square Wave Voltammetry
•
advantage of square wave voltammetry is that the entire scan can be performed on
a single mercury drop in about 10 seconds, as opposed to about 5 minutes for the
techniques described previously. SWV saves time, reduces the amount of mercury
used per scan by a factor of 100. If used with a pre-reduction step, detection limits
of 1-10 ppb can be achieved, which rivals graphite furnace AA in sensitivity.
•
data for SWV similar to DPP
•
height and width of the wave depends on the exact combination of
experimental parameters (i.e. scan rate and pulse height
Square-Wave Voltammetry
Reversible System
- The peak-shaped Polarogram is symmetric about the
half-wave potential
- Peak current is proportional to the concentration
- The net current is larger than the forward or reverse currents
Generation of a square-wave voltammetry excitation signal. The staircase signal in (a) is
added to the pulse train in (b) to give the square-wave excitation signal in (c ).
Current response for a reversible reaction to excitation signal.
Square-Wave Voltammetry
- Higher sensitivity than differential-pulse in which
reverse current is not used
(currents 4 times higher for reversible systems)
(currents are 3.3 times higher for irreversible systems)
- Low detection limits up to 10
-8
M
- Reduced analysis time due to higher scan rates
(few seconds compared to ~3 minutes for differential pulse)
Entire Polarogram is recorded on a single mercury drop
- Effective Scan Rate = f∆E
s
f = square-wave frequency
∆E
s
= step height
- May be used for kinetic studies
C
y
c
l
i
c
V
o
l
t
a
m
m
e
t
r
y
(
C
V
)
Cyclic voltammetry (CV) is an electrolytic method that uses microelectrodes and an
unstirred solution so that the measured current is limited by analyte diffusion at the
electrode surface. The electrode potential is ramped linearly to a more negative potential,
and then ramped in reverse back to the starting voltage. The forward scan produces a
current peak for any analytes that can be reduced through the range of the potential scan.
The current will increase as the potential reaches the reduction potential of the analyte, but
then falls off as the concentration of the analyte is depleted close to the electrode surface.
As the applied potential is reversed, it will reach a potential that will reoxidize the product
formed in the first reduction reaction, and produce a current of reverse polarity from the
forward scan. This oxidation peak will usually have a similar shape to the reduction peak.
The peak current, i
p
, is described by the Randles-Sevcik equation:
i
p
= (2.69x10
5
) n
3/2
A C D
1/2
v
1/2
where n is the number of moles of electrons transferred in the reaction, A is the area of the
electrode, C is the analyte concentration (in moles/cm
3
), D is
The potential difference between the reduction and oxidation peaks is theoretically 59 mV
for a reversible reaction. In practice, the difference is typically 70-100 mV. Larger
differences, or nonsymmetric reduction and oxidation peaks are an indication of a
nonreversible reaction. These parameters of cyclic voltammograms make CV most suitable
for characterization and mechanistic studies of redox reactions at electrodes.
Cyclic voltammetry
In cyclic voltammetry, a periodic, triangular wave form is applied to the working
electrode. The portion between times
t
o
and
t
1
is a linear voltage ramp. In CV, the time
is on the order of seconds. The ramp is then reversed to bring the potential back to its
initial value at time
t
2
.
Cyclic voltammetry is used principally to characterize the redox properties of
compounds and to study the mechanisms of redox reactions.
Waveform used in cyclic voltammetry.
Cyclic voltammetric excitation signal.
Cyclic Voltammetry
•
t
0
→ t
1
: cathodic wave
–
Instead of leaving off at the top of the
wave, current decreases at more
negative potential
← diffusion is too slow to replenish
analyte near the electrode
•
t
1
→ t
2
: anodic wave
–
The potential is reversed and, reduced
product near the electrode is oxidized
Cyclic voltammograms are recorded either with
an osciloscope or with a fast X-Y recorder.
The current decreases after the cathodic peak
because of concentration polarization.
For a reversible reaction, half-wave potential
lies midway between the cathodic and anodic
peaks.
(a)
Potential vs time waveform and
(b)
cyclic voltammogram for a solution that is
6.0 mM in K
3
Fe(CN)
6
and 1.0M in KNO
3
.
5.375mM (left) and 0.5375 (right) mM Ferrocene in Acetonitrile
Fe(C
5
H
5
)
2
Hydrodynamic Voltammetry
•
In hydrodynamic voltammetry the solution is stirred by
rotating the electrode.
•
Current is measured as a function of the potential applied to
a solid working electrode.
•
The same potential profiles used for polarography, such as a
linear scan or a differential pulse, are used in hydrodynamic
voltammetry.
•
The resulting voltammograms are identical to those for
polarography, except for the lack of current oscillations
resulting from the growth of the mercury drops.
•
Because hydrodynamic voltammetry is not limited to Hg
electrodes, it is useful for the analysis of analytes that are
reduced or oxidized at more positive potentials.
Stripping Ansalysis
•
Stripping analysis is an analytical technique that involves
•
Preconcentration of a metal phase onto a solid electrode surface or into Hg
(liquid) at negative potentials and selective oxidation of each metal phase
species during an anodic potential sweep.
•
The analyte from a
dilute
solution is first concentrated in a single drop of
Hg (or any micro-electorde) by electroreduction or electro-oxidation.
•
The electroactive species is then
stripped
from the electrode by reversing
the direction of the voltage sweep.
•
The potential becomes more
positive, oxidizing
the species back into
solution (
anodic stripping voltammetry)
or more negative reducing the
species back into solution (
cathodic stripping voltammetry)
•
The current measured during the oxidation or reduction is related to the
quantity of analyte
•
The polarographic signal is recorded during the oxidation or reduction
process.
•
The deposition step amounts to an electrochemical preconcentration of
the analyte; that is, the concentration of the analyte in the surface of the
microelectrode is far greater than it is in the bulk solution.
Stripping Ansalysis
•
Very sensitive and reproducible (RSD<5%) method for
•
trace metal ion analysis in aqueous media.
•
Concentration limits of detection for many metals are in
•
the low ppb to high ppt
•
range (S/N=3) and this compares
•
favorably with AAS or ICP analysis.
•
Field deployable instrumentation that is inexpensive.
•
Approximately 12-15 metal ions can be analyzed for by
•
this method.
•
The stripping peak currents and peak widths are a
•
function of the size, coverage and distribution of the
•
metal phase on the electrode surface (Hg or alternate)
(a)
Excitation signal for
stripping determination of
Cd
2+
and Cu
2+
(b)
Voltamrnograrn
.
Amperometry
•
A constant potential is applied to the working electrode, and
current is measured as a function of time.
•
Since the potential is not scanned, amperometry does not lead to
a voltammogram.
•
One important application of amperometry is in the construction
of chemical sensors. One of the first amperometric sensors to be
developed was for dissolved O
2
in blood
•
The design of the amperometric sensor is shown below and is
similar to potentiometric membrane electrodes.
•
A gas‑permeable membrane is stretched across the end of the
sensor and is separated from the working and counter electrodes
by a thin solution of KCI.
•
The working electrode is a Pt disk cathode, and an Ag ring anode
is the counter electrode
•
Although several gases can diffuse across the membrane (O
2
, N
2
,
CO
2
), only O
2
is reduced at the cathode
Amperometry
•
A constant potential is applied to the working electrode, and
current is measured as a function of time.
•
Since the potential is not scanned, amperometry does not
lead to a voltammogram.
•
One important application of amperometry is in the
construction of chemical sensors. One of the first
amperometric sensors to be developed was for dissolved O
2
in blood
•
The design of the amperometric sensor is shown below and
is similar to potentiometric membrane electrodes.
•
A gas‑permeable membrane is stretched across the end of
the sensor and is separated from the working and counter
electrodes by a thin solution of KCI.
•
The working electrode is a Pt disk cathode, and an Ag ring
anode is the counter electrode
•
Although several gases can diffuse across the membrane (O
2
,
N
2
, CO
2
), only O
2
is reduced at the cathode
Differential-pulse anodic stripping voltammogram of 25 ppm zinc,
cadmium, lead, and copper.
C
l
a
r
k
a
m
p
e
r
o
m
e
t
r
i
c
S
e
n
s
o
r
f
o
r
t
h
e
D
e
t
e
r
m
i
n
a
t
i
o
n
o
f
D
i
s
s
o
l
v
e
d
O
2
Quantitative Analysis
•
The principal use of polarography is in
quantitative analysis.
•
Since the magnitude of the diffusion current
is proportional to the concentration of
analyte, the height of a polarographic wave
tells how much analyte is present.
One Standard Method
•
It is assumed that a linear relationship holds
for the concentration and the wave height.
•
Assuming that the wave heightes for the
standard and the analyte were h
1
and h
2
and
the concentrations were X
standard
and X
analyte
then,
•
H
standadr
/ h
analyte
= X
standard
/ X
analyt
Standard curves
•
The most reliable, but tedious, method of quantitative
analysis is to prepare a series of known concentrations of
analyte in otherwise identical solutions.
•
A polarogram of each solution is recorded, and a graph of the
diffusion current versus analyte concentration is prepared.
•
Finally, a polarogram of the unknown is recorded, using the
same conditions.
•
From the measured diffusion current and the standard curve,
the concentration of analyte can be determined.
•
The figure below shows an example of the linear relationship
between diffusion current and concentration.
S
t
a
n
d
a
r
d
c
u
r
v
e
f
o
r
p
o
l
a
r
o
g
r
a
p
h
i
c
a
n
a
l
y
s
i
s
o
f
A
l
(
I
I
I
)
i
n
0
.
2
M
s
o
d
i
u
m
a
c
e
t
a
t
e
,
p
H
4
.
7
.
I
d
i
s
c
o
r
r
e
c
t
e
d
f
o
r
t
h
e
r
e
s
i
d
u
a
l
c
u
r
r
e
n
t
Example 1
Using a Standard Curve
•
•
Suppose that 5.00 mL of an unknown sample of Al(III) was
placed in a 100‑mL volumetric flask containing 25.00 mL of 0.8
M sodium acetate (pH 4.7) and 2.4 mM pontachrome violet
SW (a maximum suppressor). After dilution to 100 mL, an
aliquot of the solution was analyzed by polarography. The
height of the polarographic wave was 1.53
µ
A, and the
residual current‑measured at the same potential with a
similar solution containing no Al(III)‑was 0.12
µ
A. Find the
concentration of Al(III) in the unknown.
•
The corrected diffusion current is 1.53 ‑ 0.12
= 1.41
µ
A.
•
In the figure above, 1.41
µ
A corresponds to
[AI(III)] = 0.126 mm.
•
Since the unknown was diluted by a factor of
20.0 (from 5.00 mL to 100 mL) for analysis,
the original concentration of unknown must
have been
(20.0)(0.126) = 2.46 mm.
Standard addition method
•
The standard addition method is most useful when the
sample matrix is unknown or difficult to duplicate in
synthetic standard solutions.
•
This method is faster but usually not as reliable as the
method employing a standard curve.
•
First, a polarogram of the unknown is recorded. Then, a
small volume of concentrated solution containing a known
quantity of the analyte is added to the sample.
•
With the assumption that the response is linear,
the increase
in diffusion current of this new solution can be used to
estimate the amount of unknown in the original solution.
•
For greatest accuracy, several standard additions are made.
•
The diffusion current of the unknown will be proportional to
the concentration of unknown, C
x
:
•
l
d(unknown)
= k
C
x
•
where k is a constant of proportionality.
•
Let the concentration of standard solution be C
S
. When V
S
mL
of standard solution is added to V
x
mL of unknown,
•
The diffusion current is the sum of diffusion currents due to
the unknown and the standard.
r
e
a
r
r
a
n
g
e
a
n
d
s
o
l
v
e
f
o
r
C
x
Example 2:
Standard Addition Calculation
•
A
25.0‑mL sample
of
Ni
2+
gave a wave height
of
2.36
µA
(corrected for residual
current) in a polarographic analysis.
•
When 0.500 mL
of
solution containing 28.7
mM Ni
2+
was added, the wave height
increased to 3.79
µA.
Find the concentration
of
Ni
2+
in the unknown.
•
Using the above Equation we can write:
E
x
a
m
p
l
e
1
E
x
a
m
p
l
e
2
E
x
a
m
p
l
e
3
E
x
a
m
p
l
e
4
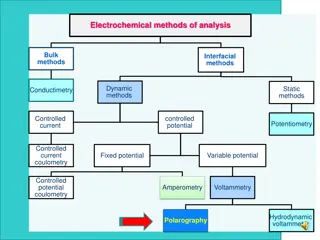
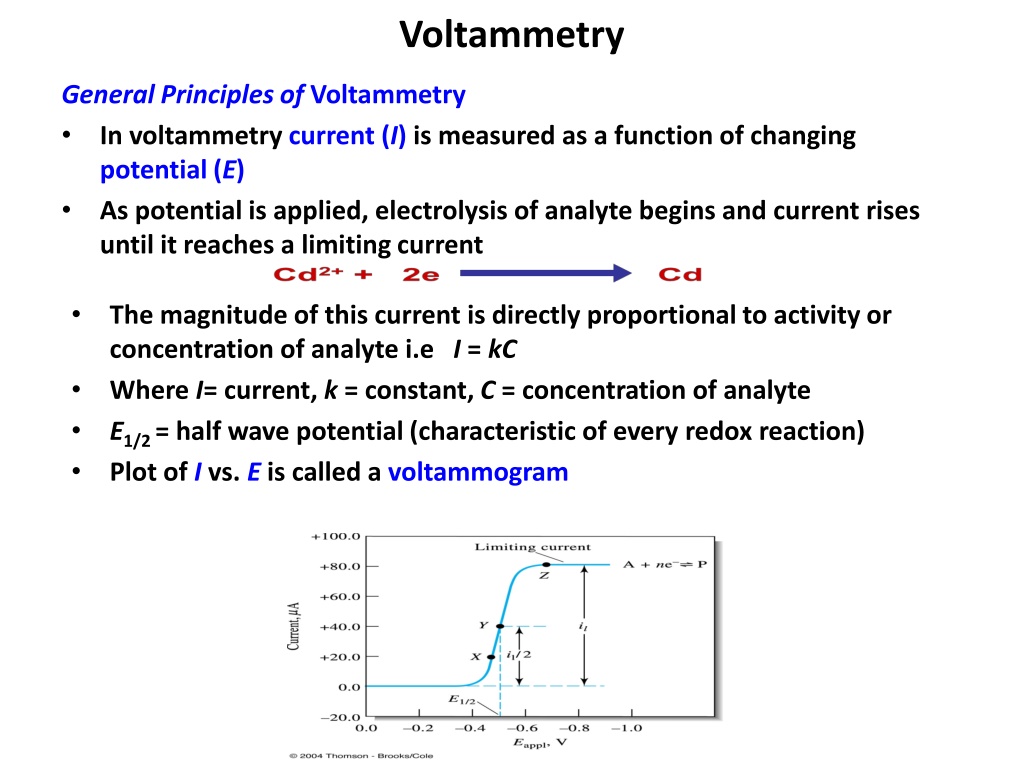
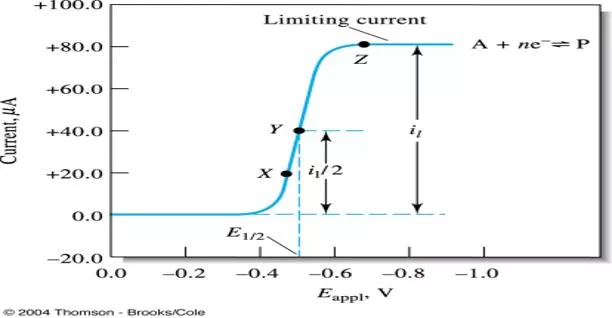
In voltammetry, current is measured as a function of changing potential. The magnitude of current is directly proportional to the activity or concentration of the analyte. A voltammogram is plotted between current and potential, showing the characteristic half-wave potential. The process involves a three-electrode cell with indicator, reference, and auxiliary electrodes. Changing potential drives nonspontaneous reactions on the indicator electrode, while the reference electrode maintains a constant potential. Supporting electrolytes are crucial in reducing resistance and migration effects. The applied potential influences the faradaic current in redox reactions.

Download Presentation

Please find below an Image/Link to download the presentation.
The content on the website is provided AS IS for your information and personal use only. It may not be sold, licensed, or shared on other websites without obtaining consent from the author.If you encounter any issues during the download, it is possible that the publisher has removed the file from their server.
You are allowed to download the files provided on this website for personal or commercial use, subject to the condition that they are used lawfully. All files are the property of their respective owners.
The content on the website is provided AS IS for your information and personal use only. It may not be sold, licensed, or shared on other websites without obtaining consent from the author.
E N D
Presentation Transcript
Voltammetry General Principles of Voltammetry In voltammetry current (I) is measured as a function of changing potential (E) As potential is applied, electrolysis of analyte begins and current rises until it reaches a limiting current The magnitude of this current is directly proportional to activity or concentration of analyte i.e I = kC Where I= current, k = constant, C = concentration of analyte E1/2 = half wave potential (characteristic of every redox reaction) Plot of I vs. E is called a voltammogram
Voltametric Cell Electrolytic cell consisting of 3 electrodes: Micro indicator electrode like Hg, Pt, Au, Ag, C or others Reference electrode like SCE or Ag/ AgCl Auxillary counter electrode like Pt wire
Typical 3-electrode Voltammetry cell Reference electrode Counter electrode Working electrode Reduction at electrode Causes current flow in External circuit O O e- Mass transport R R End of Working electrode Bulk solution
Voltametric Cell Changing potential (E) is applied on the indicator electrode (working electrode) to drive a nonspontaneous redox reaction Counter electrode serves to conduct electricity between the two electrodes Reference electrode has a constant potential throughout A supporting electrolyte is a salt added in excess to the analyte solution. Most commonly, it is an alkali metal salt that does not react at the working electrode at the potentials being used. The salt reduces the effects of migration and lowers the resistance of the solution.
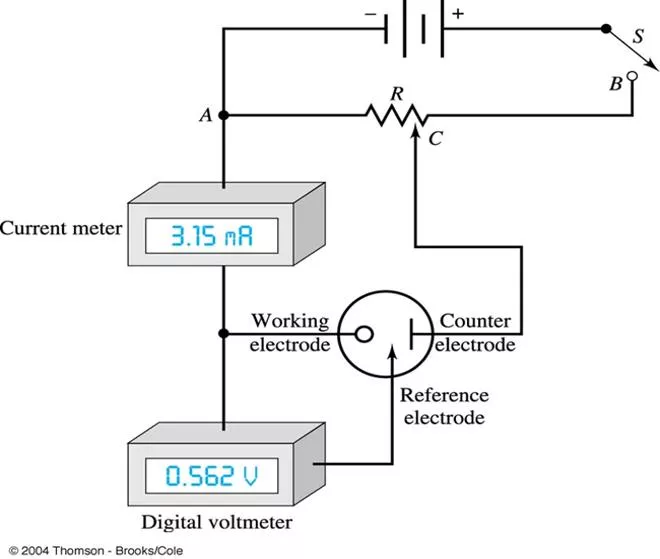
Three electrode cell: Working Reference Counter/auxilliary current flows between working and counter electrodes. Potential controlled by potentiostat working and reference electrodes. between
Influence of applied potential on the faradaic current Influence of applied potential on the faradaic current When the potential applied to the working electrode reaches to the reduction potential of the electroactive species, a reduction will take place at the electrode surface Thus, electroactive species diffuses from the bulk solution to the electrode surface and the reduction products diffuse from the electrode surface towards the bulk solution. This creates what is called the faradaic current.
0.001 M Cd2+ in 0.1 M KNO3 supporting electrolyte Electrode become more and more reducing and capable of reducing Cd2+ All Cd2+ around the electrode has already been reduced. Current at the electrode becomes limited by the diffusion rate of Cd2+ from the bulk solution to the electrode. Thus, current stops rising and levels off at a plateau id Cd2+ + 2e- Cd Current starts to be registered at the electrode i ( A) E Working electrode is no yet capable of reducing Cd2+ only small residual current flow through the electrode Current at the working electrode continue to rise as the electrode become more reducing and more Cd2+ around the electrode are being reduced. Diffusion of Cd2+ does not limit the current yet Base line of residual current -0.2 -0.4 -0.6 -0.8 -1.0 -1.2 -1.4 V vs SCE
Current in Voltammetry Current in Voltammetry When an analyte is oxidized at the working electrode, a current passes electrons through the external electric circuitry to the auxiliary electrode. This current flows from the auxiliary to the working electrode, where reduction of the solvent or other components of the solution matrix occurs . The current resulting from redox reactions at the working and auxiliary electrodes is called a faradaic current. Sign Conventions A current due to the analyte's reduction is called a cathodic current and, by convention, is considered positive. Anodic currents are due to oxidation reactions and carry a negative value.
The magnitude of the faradaic current is determined by the rate of the resulting oxidation or reduction reaction at the electrode surface. Two factors contribute to the rate of the electrochemical reaction: the rate at which the reactants and products are transported to and from the surface of the electrode (mass transport) and the rate at which electrons pass between the electrode and the reactants and products in the solution. (kinetics of electron transfer at the electrode surface)
Influence of Mass Transport on the Faradaic Current There are three modes of mass transport to and from the electrode surface: diffusion, migration, and convection. Diffusion from a region of high concentration to a region of low concentration occurs whenever the concentration of an ion or molecule at the surface of the electrode is different from that in bulk solution. Convection occurs when a mechanical means is used to carry reactants toward the electrode and to remove products from the electrode. The most common means of convection is to stir the solution using a stir bar. Other methods include rotating the electrode and incorporating the electrode into a flow cell. Migration occurs when charged particles in solution are attracted or repelled from an electrode that has a positive or negative surface charge. Unlike diffusion and convection, migration only affects the mass transport of charged particles
diffusion is the only significant means for the mass transport of the reactants and products, the current in a voltammetric cell is given by where n is the number of electrons transferred in the redox reaction, F is Faraday's constant, A is the area of the electrode, D is the diffusion coefficient for the reactant or product, CbuIk and Cx=o are the concentration of the analyte in bulk solution and at the electrode surface, and is the thickness of the diffusion layer. Diffusion current : Id is directly proportional to the concentration of the analyte. Id = limiting current residual current [C]o Ilkovic equation
Influence of the Kinetics of Electron Transfer on the Influence of the Kinetics of Electron Transfer on the Faradaic Current Faradaic Current When electron transfer kinetics at the electrode surface are fast, the redox reaction is at equilibrium, and the concentrations of reactants and products at the electrode are those specified by the Nernst equation. Such systems are considered electrochemically reversible. In other systems, when electron transfer kinetics are sufficiently slow, the concentration of reactants and products at the electrode surface, and thus the current, differ from that predicted by the Nernst equation. In this case the system is electrochemically irreversible.
Non faradaie Currents Non faradaie Currents Currents other than faradaic may also exist in an electrochemical cell that are unrelated to any redox reaction. These currents are called nonfaradaic currents The most important example of a nonfaradaic current occurs whenever the electrode's potential is changed. When mass transport takes place by migration negatively charged particles in solution migrate toward a positively charged electrode, and positively charged particles move away from the same electrode. When an inert electrolyte is responsible for migration, the result is a structured electrode-surface interface called the electrical double layer, or EDL, The movement of charged particles in solution, gives rise to a short-lived, nonfaradaic charging current. Changing the potential of an electrode causes a change in the structure of the EDL, producing a small charging current.
Residual Current Residual Current Even in the absence of analyte, a small current flows through an electrochemical cell. This current, which is called the residual current, consists of two components: a faradaic current due to the oxidation or reduction of trace impurities, a charging current. it is the current needed to charge or discharge the capacitor formed by the electrode surface-solution interface. This is called the condenser current or charging current. It is present in all voltammetric and polarographic experiments, regardless of the purity of reagents.
Types of Voltammetry Different kinds of Voltammetry Polarography Linear sweep and Cyclic Voltammetry Hydrodynamic Voltammetry Pulsed methods Stripping Voltammetry AC Voltammetry
Polarography Polarography Jaroslav Heyrovsk was the inventor of the polarographic method, and the father of electroanalytical chemistry, for which he was the recipient of the Nobel Prize. His contribution to electroanalytical chemistry can not be overestimated. All modern voltammetric methods used now in electroanalytical chemistry originate from polarography. In polarography the working electrode is a dropping mercury electrode (DME) or a mercury droplet suspended from a bottom of a glass capillary tube. Analyte is either reduced (most of the cases) or oxidized at the surface of the mercury drop. The current carrier auxiliary electrode is a platinum wire. SCE or Ag/AgCl reference electrode is used. The potential of the mercury drop is measured with respect to the reference electrode.
The DME is referred to as the working or indicator electrode, it is made up of mercury reservoir connected to a capillary tube. The capillary tube deliver mercury size of about 1mm in diameter (micro-electrode), the mercury drops every two seconds and as such a fresh surface of mercury is encountered such that the reaction at any point in time does not depend on the past history of the electrode. This therefore, makes the electrode reaction perfectly reproducible. Also since it is a micro electrode, the amount of current carried is very low (0-15UA).
Advantages and Disadvantages of the Dropping Mercury Electrode Some of the advantages of dropping mercury electrode(DME) are as follows: Mercury form amalgam with most metals. Mercury has a high hydrogen overvoltage. It provides a smooth, fresh surface for the reaction. Each drop remains unaffected and does not become contaminated by the deposited metal. Diffusion equilibrium is readily established at mercury-solution interface. Some of the disadvantages of dropping mercury electrode(DME) are as follows: It is poisonous so care should be taken in its handling. Surface area of a drop of mercury is never constant. Applied voltage produces changes in surface tension and hence change in drop size. Mercury has limited applications in analysis of more positive potential range. Following care must be taken while using dropping mercury electrode: Pure and triple distilled mercury should be used in DME Tip of DME should be always immersed in water when not in use. Tip of DME should be cleaned by dipping in nitric acid. The DME assembly should be mounted vertical on a heavy stand to be free from vibrations. It is essential to use clean and dust free tubing while setting the DME. There should be sufficient mercury in reservoir so that the pressure changes are negligible.
One serious limitation of the dropping electrode is the ease with which mercury is oxidized: this property severely limits the use of the electrode as an anode. At potentials greater than about + 0.4 V, formation of mercury(I) gives a wave that masks the curves of other oxidizable species. In the presence of ions that form precipitates or complexes with mercury(I), this behavior occurs at even lower potentials. For example, in the Figure, the beginning of an anodic wave can be seen at 0 V due to the reaction 2Hg + 2CI-< === > Hg2CI2(s) + 2e- Incidentally, this anodic wave can be used for the determination of chloride ion. 21
Another important disadvantage of the dropping mercury electrode is the nonfaradaic residual or charging current, which limits the sensitivity of the classical method to concentrations of about 10-5 M. At lower concentrations, the residual current is likely to be greater than the diffusion current, a situation that prohibits accurate measurement of the latter. Finally, the dropping mercury electrode is cumbersome to use and tends to malfunction as a result of clogging. 23
Polarography uses mercury droplet electrode that is regularly renewed during analysis. Applications: Metal ions (especially heavy metal pollutants) - high sensitivity. Organic species able to be oxidized or reduced at electrodes: quinones, reducing sugars and derivatives, thiol and disulphide compounds, oxidation cofactors (coenzymes etc), vitamins, pharmaceuticals. Alternative when spectroscopic methods fail.
SHAPE OF THE POLAROGRAM SHAPE OF THE POLAROGRAM A graph of current versus potential in a polarographic experiment is called a polarogram. Cd2+ + 2e Cd
Features of the Polarogram residual current the small current before the potential at which the analyte reacts, caused by reactive species in the matrix and by the mercury drop behaving like a capacitor limiting current the maximum current reached diffusion current the difference between the limiting and residual, and proportional to the concentration of analyte half-wave potential the potential half-way up the polarographic wave, which is similar to the reduction/oxidation potential, and characteristic of the species; current oscillations caused by the mercury drop which repeatedly falls off and is replenished from the capillary
Polarographic Mechanism When the potential is only slightly negative with respect to the calomel electrode, essentially no reduction of Cd2+ occurs. Only a small residual current flows. At a sufficiently negative potential, reduction of Cd2+ commences and the current increases. The reduced Cd dissolves in the Hg to form an amalgam. After a steep increase in current, concentration polarization sets in: The rate of electron transfer becomes limited by the rate at which Cd2+ can diffuse from bulk solution to the surface of the electrode. The magnitude of this diffusion current Id is proportional to Cd2+ concentration and is used for quantitative analysis. The upper trace in the Figure above is called a polarographic wave. The oscillating current in the Figure above is due to the growth and fall of the Hg drops. As the drop grows, its area increases, more solute can reach the surface in a given time, and more current flows. The current increases as the drop grows until, finally, the drop falls off and the current decreases sharply.
Current orrate of diffusion [C]o - [C]s The [C]o and [C]s are the concentrations in the bulk solution and at the electrode surface. The greater the difference in concentrations the more rapid will be the diffusion. At a sufficiently negative potential, the reduction is so fast that the [C]s << [C]o and equation above reduces to the form Limiting current = diffusion current [C]o The ratio of the diffusion current to the bulk solute concentration is the basis for the use of voltammetry in analytical chemistry
The magnitude of the diffusion current, is given by the Ilkovic equation: ld = (7.08 x 10⁴)nCD1/2 m 2/3 t 1/6 where Id = diffusion current, measured at the top of the oscillations in the Figure above with the units A n = number of electrons per molecule involved in the oxidation or reduction of the electroactive species. C = concentration of electroactive species, with the units mmol/L D = diffusion coefficient of electroactive species, with the units M2/s m =rate of flow of Hg, in mg/s t = drop interval, in s The number 7.08 x 10⁴ is a combination of several constants whose dimensions are such that ld will be given in , A
Thus, id is proportional to the concentration of a certain species under specific conditions and the above equation may be expressed as follows: id = kc where k is constant under the specific conditions. If k is constant for a series of standard solutions of various concentrations and an unknown, a calibration plot can be constructed and the unknown concentration can be determined. Clearly, the magnitude of the diffusion current depends on several factors in addition to analyte concentration. In quantitative polarography, it is important to control the temperature within a few tenths of a degree. The transport of solute to the electrode should be made to occur only by diffusion (no stirring).
Half Half- -wave Potential, E wave Potential, E1 1/ /2 2 Half wave potential, E1/2 is an important feature can be derived from the plarogram. It is the potential corresponding to one half the limiting current i.e. id/2. El/2 is a characteristic for each element and thus used for qualitative analysis.
Supporting electrolyte Supporting electrolyte Current flow due to electrostatic attraction (or repulsion) of analyte ions by the electrode is reduced to a negligible level by the presence of a high concentration of supporting electrolyte (1 M HCl in the Figure above). Increasing concentrations of electrolyte reduces the net current, since the rate of arrival of cationic analyte at the negative Hg surface is decreased. Typically, a supporting electrolyte concentration 50-100 times greater than the analyte concentration will reduce electrostatic transport of the analyte to a negligible level.
Effect of Dissolved Oxygen Effect of Dissolved Oxygen Oxygen dissolved in the solution will be reduced at the DME leading to two well defined waves which were attributed to the following reactions: O2(g) + 2H+ + 2e- < ==== > H2O2; E1/2 = - 0.1V H2O2 + 2H+ +2e- < ==== > 2H2O; E1/2 = - 0.9V E1/2 values for these reductions in acid solution correspond to -0.05V and -0.8V versus SCE. This indicates that dissolved oxygen interferes in the determination of most metal ions. Therefore, dissolved O2 has to be removed by bubbling nitrogen free oxygen into the solution before recording the polarogram.
Current maxima A distortion of the polarographic wave appears to be due to absorption phenomena at the surface of the mercury drop. The removed by the addition of surface active (maxima suppressors) such as gelatine, methyl cellulose or Triton X-100. maxima may be agent
Types of PolarograpicTechniques Linear Sweep polarography or Direct Current (DC) polarography The earliest voltammetric experiment was normal polarography at a dropping mercury electrode. In normal polarography the potential is linearly scanned, producing Polarogram. In LSV the major source of noise at low concentration is the capacitive current resulting from charging of electrical double layer at the electrode which limit the application of this technique to 10-5 M
Pulse polarography By using pulse or differential pulse polarography, most of the capacitive current can be eliminated with a resultant of increase in the S/N ratio of about 100. In pulse and differential pulse polarography advantage is taken of the relatively rapid decrease in the capacitive current as compared with faradic current after application of a potential to an electrode. In pulse polarography a potential pulse is applied to the mercury drop about 57ms prior to the drops fall from the capillary. The capacitive current exponential decays to nearly zero during the first 40ms of the pulse and the remaining faradic current is measured during the last 17ms of the pulse. A drop knocker is used to control time and to permit application of the pulse just before the drop is knocked from the capillary. It increase the sensitivity and the detection limits that are about 10 times lower then with low current.
Differential Pulse Polarography In differential pulse polarography, the current is typically measured during the 17ms prior to the application of the pulse and during the last 17ms of application of the pulse and after decay of the capacitive current. The polarogram is a plot of the difference between the two currents as a function of the linearly increasing voltage. The drop is then mechanically dislodged. The current is not measured continuously. Rather, it is measured once before the pulse and again for the last 17 ms of the pulse. The polarograph subtracts the first current from the second and plots this difference versus the applied potential (measured just before the voltage pulse). The resulting differential pulse polarogram is nearly the derivative of a direct current polarogram, as shown in the Figure Again we have decreased the charging current and increased the faradaic current. Generally, detection limits with differential pulse polarography are two to three orders of magnitude lower than those for classical polarography and lies in the range of 10-7 to 10-8 M.
Polarogram for a differential pulse polarography experiment. Here i = is2 is1. The peak potential, Epeak, is colsely related to the polarographic half-wave potential.
Square-wave polarography. This is the same as the differential pulse method except we do not have a continuous ramp of voltage but instead the potential is stepped as in the picture. The size of the pulses is such that the material reduced in the forward pulse is oxidized in the reverse pulse. So we have little net consumption of analyte. The detection limit for square-wave polarography is about the same as for differential pulse about 10-7 to 10-8 M. The advantage of the square-wave approach is the speed of the measurement. With steps in the microseconds, an entire polarogram can be obtained in 10 msec. The entire scan can be performed in the last few msecs of the life of a single drop of mercury, when the charging current is essential zero. The speed of the measurement also permits increase in precision by signal averaging data from a number of polarographic scans.
Square wave polarography Square wave polarography is more sensitive and much faster than differential pulse polarography. The square wave is also better at rejecting background signals such as those generated by reduction of oxygen. Waveform for square wave polarography.
Square Wave Voltammetry advantage of square wave voltammetry is that the entire scan can be performed on a single mercury drop in about 10 seconds, as opposed to about 5 minutes for the techniques described previously. SWV saves time, reduces the amount of mercury used per scan by a factor of 100. If used with a pre-reduction step, detection limits of 1-10 ppb can be achieved, which rivals graphite furnace AA in sensitivity. data for SWV similar to DPP height and width of the wave depends on the exact combination of experimental parameters (i.e. scan rate and pulse height
Square-Wave Voltammetry Reversible System - The peak-shaped Polarogram is symmetric about the half-wave potential - Peak current is proportional to the concentration - The net current is larger than the forward or reverse currents
Generation of a square-wave voltammetry excitation signal. The staircase signal in (a) is added to the pulse train in (b) to give the square-wave excitation signal in (c ). Current response for a reversible reaction to excitation signal.
Square-Wave Voltammetry - Higher sensitivity than differential-pulse in which reverse current is not used (currents 4 times higher for reversible systems) (currents are 3.3 times higher for irreversible systems) - Low detection limits up to 10-8 M - Reduced analysis time due to higher scan rates (few seconds compared to ~3 minutes for differential pulse) Entire Polarogram is recorded on a single mercury drop - Effective Scan Rate = f Es f = square-wave frequency Es = step height - May be used for kinetic studies
Cyclic Voltammetry (CV) Cyclic voltammetry (CV) is an electrolytic method that uses microelectrodes and an unstirred solution so that the measured current is limited by analyte diffusion at the electrode surface. The electrode potential is ramped linearly to a more negative potential, and then ramped in reverse back to the starting voltage. The forward scan produces a current peak for any analytes that can be reduced through the range of the potential scan. The current will increase as the potential reaches the reduction potential of the analyte, but then falls off as the concentration of the analyte is depleted close to the electrode surface. As the applied potential is reversed, it will reach a potential that will reoxidize the product formed in the first reduction reaction, and produce a current of reverse polarity from the forward scan. This oxidation peak will usually have a similar shape to the reduction peak. The peak current, ip, is described by the Randles-Sevcik equation: ip = (2.69x10⁵) n3/2 A C D1/2 v1/2 where n is the number of moles of electrons transferred in the reaction, A is the area of the electrode, C is the analyte concentration (in moles/cm3), D is The potential difference between the reduction and oxidation peaks is theoretically 59 mV for a reversible reaction. In practice, the difference is typically 70-100 mV. Larger differences, or nonsymmetric reduction and oxidation peaks are an indication of a nonreversible reaction. These parameters of cyclic voltammograms make CV most suitable for characterization and mechanistic studies of redox reactions at electrodes.
Cyclic voltammetry In cyclic voltammetry, a periodic, triangular wave form is applied to the working electrode. The portion between times to and t1 is a linear voltage ramp. In CV, the time is on the order of seconds. The ramp is then reversed to bring the potential back to its initial value at time t2. Cyclic voltammetry is used principally to characterize the redox properties of compounds and to study the mechanisms of redox reactions. Cyclic voltammetric excitation signal. Waveform used in cyclic voltammetry.
Cyclic Voltammetry t0 t1 : cathodic wave Instead of leaving off at the top of the wave, current decreases at more negative potential diffusion is too slow to replenish analyte near the electrode t1 t2 : anodic wave The potential is reversed and, reduced product near the electrode is oxidized 2.22 57.0(mV) n RT = = (at 25 C) E E pa pc nF Cyclic voltammograms are recorded either with an osciloscope or with a fast X-Y recorder. The current decreases after the cathodic peak because of concentration polarization. For a reversible reaction, half-wave potential lies midway between the cathodic and anodic peaks.
(a) Potential vs time waveform and (b) cyclic voltammogram for a solution that is 6.0 mM in K3Fe(CN)6 and 1.0M in KNO3.
Fe(C5H5)2 5.375mM (left) and 0.5375 (right) mM Ferrocene in Acetonitrile
Hydrodynamic Voltammetry In hydrodynamic voltammetry the solution is stirred by rotating the electrode. Current is measured as a function of the potential applied to a solid working electrode. The same potential profiles used for polarography, such as a linear scan or a differential pulse, are used in hydrodynamic voltammetry. The resulting voltammograms are identical to those for polarography, except for the lack of current oscillations resulting from the growth of the mercury drops. Because hydrodynamic voltammetry is not limited to Hg electrodes, it is useful for the analysis of analytes that are reduced or oxidized at more positive potentials.


")


 Potential vs time waveform and")
2")