Virginia's Use-Value Assessment Program
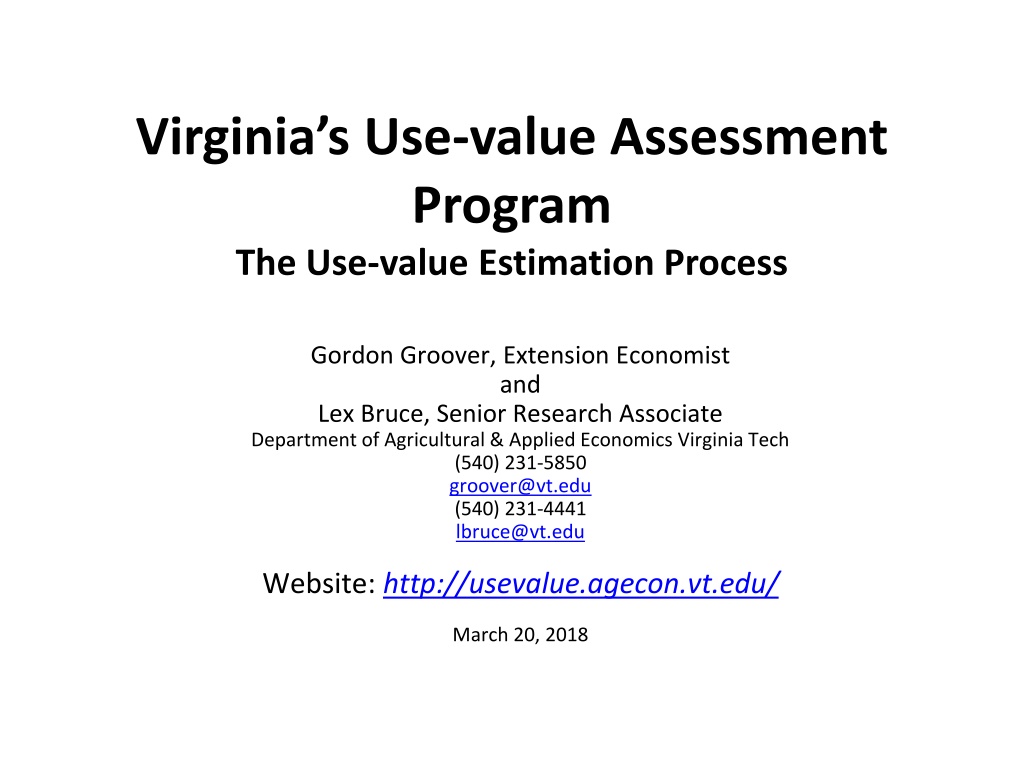

Virginia’s Use-value Assessment
Program
The Use-value Estimation Process
Gordon Groover, Extension Economist
and
Lex Bruce, Senior Research Associate
Department of Agricultural & Applied Economics Virginia Tech
(540) 231-5850
(540) 231-4441
March 20, 2018
Outline
•
Brief History
•
Why Use-value Assessment?
•
Approaches to estimating land values
•
Income approach
•
Rental rate approach
•
Discussion
TY2018:
Counties/Cities* with use-value assessment ordinances
(
Agricultural & Horticultural, Forest, and Open Space
)
* Counties/Cities are identified from annual use-value reports and may differ from actual implementation. Contact government officials in each county/city
for the current use-value implementation. Not all participating cities are identified on this map.
Agricultural & Horticultural, Forest, and Open Space
Agricultural & Horticultural and Forest
Agricultural & Horticultural
Open Space
Open Space and Agricultural & Horticultural
No use-value assessment ordinance
Agricultural & Forestal Districts Only
Lee
Scott
Wise
Dickenson
Buchanan
Russell
Tazewell
Bland
Wythe
Smyth
Washington
Grayson
Carroll
Patrick
Floyd
Henry
Pittsylvania
Halifax
Mecklenburg
Brunswick
Lunenburg
Giles
Craig
Alleghany
Bath
Highland
Rockbridge
Augusta
Roanoke
Montgomery
Pulaski
Botetourt
Franklin
Bedford
Campbell
Charlotte
Prince
Edward
Appomattox
Buckingham
Cumberland
Amelia
Nottoway
Dinwiddie
Powhatan
Chesterfield
Amherst
Page
Rockingham
Shenan
-doah
Fredrick
Clark
Loudoun
Fairfax
Prince
William
King George
Fauquier
Rappa-
hannock
Culpeper
Madison
Greene
Albemarle
Nelson
Orange
Louisa
Caroline
Spotsylvania
Fluvanna
Goochland
Hanover
Stafford
Westmoreland
Richmond
Northumberland
Lancaster
Essex
King &
Queen
King William
New
Kent
Accomack
Northampton
Henrico
Middlesex
Mathews
Gloucester
James City
Charles
City
York
Newport News
Hampton
Norfolk
Prince
George
Surry
Sussex
Southampton
Isle of
Wight
Suffolk
Chesapeake
Virginia
Beach
Alexandria
Danville
Arlington
Greensville
Warren
Ag and Hort
: 90 counties/cities
Forest
: 74 counties/cities
Open Space
: 56 counties/cities
Use-Value Assessment in Virginia
•
Virginia use-value taxation legislation was passed in
1972, effective for the tax year 1974.
•
Code of Virginia,
Title 58.1 §58.1-3229 through
§58.1-3244), enacted in 1971, authorized use-value
taxation with the stated purposes of:
–
Encouraging the
preservation
and
proper use
of
such
real estate
…source of…
agricultural
,
horticultural
, and
forest
products and
open
spaces
within the reach of concentrations of
population;
–
Conserving
natural resources
,…
prevent
erosion
,…
safe water
supplies;
(continued…)
Use-Value Assessment in Virginia
(continued…)
–
Preserving
scenic natural beauty and open
spaces
;
–
Promoting proper
land-use planning
and the
orderly development
–
Promoting a balanced economy and
ameliorating pressures
that force conversion of
such real estate ….preservation for
agricultural
,
horticultural
,
forestal
, or
open space
purposes.
•
State Land Evaluation and Advisory Council (
SLEAC
)
was created in 1973 with the mandate to estimate
the use value of eligible land for each jurisdiction
participating in the use-value taxation program.
Virginia’s Use-Value
Assessment Program
•
Virginia law allows for the preferential
taxation of
agricultural
,
horticultural
,
forest
,
and
open space
land
•
Eligible land
in any of these categories can be
assessed at the land’s
value in use
(use-
value) as opposed to the land’s
market value
Eligible Land?
•
Agricultural and horticultural defined by
VA Department of Agriculture and
Consumer Services (VDACS)
•
Forest defined by Department of Forestry
(DOF)
•
Open space defined by Department
Conservation and Recreation (DCR)
•
See State Land Evaluation and Advisory
Council (SLEAC) manual for details
4.6.5 Agricultural Property - The Standard on Mass Appraisal of Real Property
International Association of Assessing Officers (IAAO 2012)
If adequate sales data are available and agricultural property is to be appraised
at market value, the sales comparison approach would be preferred. However,
nearly every state or province provides for use-value assessment (and usually
appraisal), which significantly understates the market value for agricultural
property, so the sales comparison approach is usually not applicable. Because
of this limitation,
it is imperative to obtain good income data and to use the
income approach for agricultural land
.
Land rents are often available,
sometimes permitting the development and application of overall
capitalization rates
. This method, of course, also entails the estimation of
normal land rents for unrented parcels. When agricultural parcels include
improvements, the cost approach or sales comparison models that provide
separate building values may be used to determine their value.
…. to use the income approach for
agricultural land… Land rents ….
Value in Use?
And the Code of VA allows for income and
rental rate approaches
Identify components of farmland value?
Value in use, How?
Capozza, Dennis R. and Robert W. Helsley. 1989. “The Fundamentals of Land Prices and Urban Growth.”
Journal of Urban Economics
.
26 (3): 295–306.
minus
minus
Procedures for Estimating
Agricultural and Horticultural
Values in Use
Two Approaches
1.
Net income
Capitalized (Income Approach)
Original model developed by Marshal (VT), Fraher,
(TAX), Seward (VDACS), Poole (VT Grad Student) ~
1974-1975.
2.
Rental rates
Capitalized (Rental Rate
Approach)
Implemented in 2010 by Groover and Bruce
Income approach for each County
•
Task
: How to create an annual stream of
net income that will be
capitalized
?
•
How?
–
Build
on secondary/published data
–
Use
Net Returns = Income - Costs
–
How?
Define a representative farm (composite
farm) – based on current Ag Census for each
county
–
Create
an enterprise budget for each crop to
yield
Net Returns (NR)
–
Identify
crop-based
federal payments
–
Define
Capitalization Rate
–
Apply
soil index
–
Final Estimates
Baseline Data - Ag Census
•
Conducted and published by National
Agricultural Statistics Service (USDA/NASS)
–
Published every 5 years
–
Current Ag Census 2012 (released in 2014)
•
Use the following for each county
–
Number of
farms reported
–
Individual crops grown e.g., corn, wheat,
pasture…
–
Acres
reported for each crop grown
Composite Farm
•
Define
-
Composite Farm
(CF) A.K.A. Average
Farm
–
For each reported crop: Divide acres by number
of farms (Acres ÷ Farms)
–
If the values is
>0.50
ac, included in the CF
–
If
≤ 0.50
ac, excluded from CF
–
Statewide there are
16 crops
that are included in
at least one county
•
Middlesex - 2012
–
73
reported farms => more land owners
–
Five
CF crops, e.g., corn+silage, hay+haylage,
pasture, soybeans, and wheat.
Composite Farm - Middlesex
Example for Corn = 4,637 ac / 73 farms = 64 acres of
corn in the Composite Farm (CF)
Crop Budgets
•
Created for all CF crops
•
Based on VCE enterprise budget
format
•
Yields and Prices -> NASS
•
Seeding and lime rates –> VCE
recommendation
•
N,P, & K inputs are based on yield-
driven nutrient removal rates
(International Plant Nutrition
Institute)
•
AgFrist -> short-term interest
Crop Budgets
•
Pesticides -> Pest Management
Guidelines (PMG)
•
Application costs –> custom rates
•
Machinery usage and costs -> A. Society
of Ag and Biological Engineers’ equations
•
Fuel prices -> U.S. Dept of Energy
•
Crop insurance -> USDA-RMA
•
Labor hours function of machinery hours
•
Labor rate -> NASS
•
Note
: Budgeted Net Returns
lag 2 years
,
e.g., Tax Year 2018 reflects 2016 data
Example Budget
Middlesex
Corn Grain no-till
TY2018
Net Returns = Income - Costs
Corn: Yield = 147.5 bu/ac * Price = $3.75/bu = $553.13
Net Crop Insurance = $44.74
Total Income
= $597.87
Pre-Harvest Costs:
N 144 Lb
Price = $0.44/lbs = $63.28/ac
Harvest Costs:
Labor, fuel &
oil, drying, hauling = $77/ac
Fixed Costs:
Machinery and
Overhead = $83/ac
Total Costs
= $535/ac
NR = $598 - $535 =
$63/ac
Olympic Averaging
•
The Net Return for each CF crop requires
7 - years of crop budgets
•
7-year Olympic Averaging drops the
highest and lowest values and then
straight averages the remaining 5 values
•
Middlesex Corn Grain example 2012-
2018
Lowest
Highest
Federal Payments
•
USDA-FSA
provides
data
for program
crops by county
•
Middlesex receives payments for
corn,
soybeans, and wheat.
•
Annual payments = Payment/crop
acreage
•
For example in TY2018, Middlesex
received
$23,646 in federal payments
for corn.
TY2017
$163,626.54/8,239 ac =
$19.86/ac
TY2018
$23,645.93/8,239 ac =
$2.87/ac
Olympic Averaging
Middlesex Corn Grain example 2012-2018
Lowest
Highest
•
Corn Net Return for TY2018
Oly AVG Fed Pay + Oly AVG Budget
$17.67 + $140.23 =
$157.89
•
Highest
Lowest
Middlesex Crop Budgets and Federal Payments
Tax Years 2010-2018
Final Net Returns
Middlesex County TY2018
•
Composite Farm weighted NR by crop
acreage
Reflects double-cropped wheat (44 ac)
Capitalization Rate
Why use Capitalization Rate?
•
Cap Rate = Net Return ÷ Value
Farmland
•
Farmland Value = NR ÷ Cap Rate
•
$100 per year ÷ 10% = $1,000
•
Cap Rate = Interest Rate + Property
Tax
Federal Land Bank long
term interest rate - AgFirst
(10 year average)
Effective Tax Rates for all
counties - VA Department of
Taxation (10 year average)
Middlesex TY2018
Adjustments for Soil Capabilities
Indexing for Soil Productivity
Adjusting to Class III land
Why?
•
Data reflects average soil productivity for each
county
•
Values are adjusted to reflect Class III
productivity
Final Estimates Middlesex
TY2018
•
Note: Final estimated values are rounded to the nearest $10
•
The Class III w/out risk estimate of $2,036.71 is reported as
$2,040
Rental Rate Approach Middlesex
TY2018
•
Starting 2009 NASS published rental rate data
annually* for
–
Cropland
–
Irrigated cropland
–
Pasture land
•
Middlesex County rental rates for TY2018 (NASS)
–
Cropland = $1,020 Eastern District (Combined County)
–
Pastureland = not published
*Sometimes biennially based on NASS funding
Rental Rate Use Value Middlesex
TY2018
Rental Rate Estimates are published annually
– not averaged over time
1
Eastern District Cropland combined county
Income Approach and Rental Rate Approach:
Compared
Table 1
: 2016 cropland and pastureland values based on NASS
1
capitalized rental rates
Rental Rates TY2018
Source: USDA/ERS Farms and Land in Farms and USDA/ERS Farm Income and Wealth Statistics
Real Net Farm Income
Virginia $/farm
(Index 2009=100)
Surrounding Counties Deferred Values?
Thanks!
&
Discussion & Questions?
usevalue.agecon.vt.edu
Virginia's use-value taxation legislation, enacted in 1971, aims to encourage land conservation through use-value taxation. The program offers approaches like income and rental rate methods to estimate land values accurately.

Download Presentation

Please find below an Image/Link to download the presentation.
The content on the website is provided AS IS for your information and personal use only. It may not be sold, licensed, or shared on other websites without obtaining consent from the author. Download presentation by click this link. If you encounter any issues during the download, it is possible that the publisher has removed the file from their server.
E N D
Presentation Transcript
Virginias Use-value Assessment Program The Use-value Estimation Process Gordon Groover, Extension Economist and Lex Bruce, Senior Research Associate Department of Agricultural & Applied Economics Virginia Tech (540) 231-5850 groover@vt.edu (540) 231-4441 lbruce@vt.edu Website: http://usevalue.agecon.vt.edu/ March 20, 2018
Outline Brief History Why Use-value Assessment? Approaches to estimating land values Income approach Rental rate approach Discussion
TY2018: Counties/Cities* with use-value assessment ordinances (Agricultural & Horticultural, Forest, and Open Space) Agricultural & Horticultural, Forest, and Open Space Agricultural & Horticultural and Forest Agricultural & Horticultural Open Space Open Space and Agricultural & Horticultural No use-value assessment ordinance Agricultural & Forestal Districts Only Fredrick Arlington Clark Loudoun Alexandria Warren Shenan -doah Fauquier Fairfax Prince William Essex Rappa- hannock Culpeper Madison Greene Orange Page King William King & Queen Rockingham Stafford Highland Richmond King George Augusta Spotsylvania Westmoreland Northumberland Albemarle Ag and Hort: 90 counties/cities Bath Caroline Louisa Rockbridge Forest: 74 counties/cities Open Space: 56 counties/cities Fluvanna Alleghany Hanover Nelson Accomack Goochland Lancaster Middlesex Mathews Gloucester Henrico Amherst Buckingham Powhatan New Kent Botetourt Craig Cumberland Appomattox Chesterfield Charles City Prince George Northampton Giles Roanoke Amelia Bedford Prince Edward Buchanan Campbell Montgomery James City York Hampton Nottoway Bland Dickenson Tazewell Pulaski Surry Charlotte Dinwiddie Isle of Wight Wise Sussex Russell Wythe Floyd Franklin Lunenburg Smyth Newport News Norfolk Virginia Beach Halifax Brunswick Carroll Pittsylvania Washington Henry Lee Scott Southampton Grayson Patrick Mecklenburg Suffolk Danville Greensville Chesapeake * Counties/Cities are identified from annual use-value reports and may differ from actual implementation. Contact government officials in each county/city for the current use-value implementation. Not all participating cities are identified on this map.
Use-Value Assessment in Virginia Virginia use-value taxation legislation was passed in 1972, effective for the tax year 1974. Code of Virginia, Title 58.1 58.1-3229 through 58.1-3244), enacted in 1971, authorized use-value taxation with the stated purposes of: Encouraging the preservation and proper use of such real estate source of agricultural, horticultural, and forest products and open spaces within the reach of concentrations of population; Conserving natural resources, prevent erosion, safe water supplies; (continued )
Use-Value Assessment in Virginia (continued ) Preserving scenic natural beauty and open spaces; Promoting proper land-use planning and the orderly development Promoting a balanced economy and ameliorating pressures that force conversion of such real estate .preservation for agricultural, horticultural, forestal, or open space purposes. State Land Evaluation and Advisory Council (SLEAC) was created in 1973 with the mandate to estimate the use value of eligible land for each jurisdiction participating in the use-value taxation program.
Virginias Use-Value Assessment Program Virginia law allows for the preferential taxation of agricultural, horticultural, forest, and open space land Eligible land in any of these categories can be assessed at the land s value in use (use- value) as opposed to the land s market value
Eligible Land? Agricultural and horticultural defined by VA Department of Agriculture and Consumer Services (VDACS) Forest defined by Department of Forestry (DOF) Open space defined by Department Conservation and Recreation (DCR) See State Land Evaluation and Advisory Council (SLEAC) manual for details
Value in Use? 4.6.5 Agricultural Property - The Standard on Mass Appraisal of Real Property International Association of Assessing Officers (IAAO 2012) . to use the income approach for agricultural land Land rents . If adequate sales data are available and agricultural property is to be appraised at market value, the sales comparison approach would be preferred. However, nearly every state or province provides for use-value assessment (and usually appraisal), which significantly understates the market value for agricultural property, so the sales comparison approach is usually not applicable. Because of this limitation, it is imperative to obtain good income data and to use the income approach for agricultural land. Land rents are often available, sometimes permitting the development and application of overall capitalization rates. This method, of course, also entails the estimation of normal land rents for unrented parcels. When agricultural parcels include improvements, the cost approach or sales comparison models that provide separate building values may be used to determine their value. And the Code of VA allows for income and rental rate approaches
Value in use, How? Identify components of farmland value? Market Value of 1.0 acre of farmland $7,000 minus Proximity to amenities $2,000 minus Accessibility/distance to the city center $1,000 minus Cost of conversion or development to non Ag use $2,000 minus Growth premium population increase $1,000 leaves Capitalized annual stream of net income (rents) from farming $1,000 Capozza, Dennis R. and Robert W. Helsley. 1989. The Fundamentals of Land Prices and Urban Growth. Journal of Urban Economics. 26 (3): 295 306.
Procedures for Estimating Agricultural and Horticultural Values in Use
Two Approaches 1. Net income Capitalized (Income Approach) Original model developed by Marshal (VT), Fraher, (TAX), Seward (VDACS), Poole (VT Grad Student) ~ 1974-1975. 2. Rental rates Capitalized (Rental Rate Approach) Implemented in 2010 by Groover and Bruce
Income approach for each County Income Approach Task: How to create an annual stream of net income that will be capitalized? How? Build on secondary/published data Use Net Returns = Income - Costs How? Define a representative farm (composite farm) based on current Ag Census for each county Create an enterprise budget for each crop to yield Net Returns (NR) Identify crop-basedfederal payments Define Capitalization Rate Apply soil index Final Estimates Ag Census Composite Farm Crop Budgets Federal Payments Capitalization Rate Soil Index Use-value Estimates
Income Approach Baseline Data - Ag Census Ag Census Middlesex Conducted and published by National Agricultural Statistics Service (USDA/NASS) Published every 5 years Current Ag Census 2012 (released in 2014) Use the following for each county Number of farms reported Individual crops grown e.g., corn, wheat, pasture Acres reported for each crop grown Composite Farm Middlesex Crop Budgets Middlesex Federal Payments Middlesex Capitalization Rate Middlesex Soil Index Middlesex Use-value Estimates Middlesex
Income Approach Composite Farm Ag Census Middlesex Define - Composite Farm (CF) A.K.A. Average Farm For each reported crop: Divide acres by number of farms (Acres Farms) If the values is >0.50 ac, included in the CF If 0.50 ac, excluded from CF Statewide there are 16 crops that are included in at least one county Middlesex - 2012 73 reported farms => more land owners Five CF crops, e.g., corn+silage, hay+haylage, pasture, soybeans, and wheat. Composite Farm Middlesex Crop Budgets Middlesex Federal Payments Middlesex Capitalization Rate Middlesex Soil Index Middlesex Use-value Estimates Middlesex
Income Approach Composite Farm - Middlesex Ag Census Middlesex Based on 73 farms 2012 AgCensus Reported Acres Crop Composite Farm Middlesex Composite Farm Acres Alfalfa Barley Corn Cotton Hay Pasture Peanuts Potatoes Pumpkins Snap Beans Soybeans Sweet Corn Tobacco Tomatoes Watermelons Wheat Double-cropped Total Cropland Harvested 0 (D) 4,637 64 0 Crop Budgets Middlesex Federal Payments Middlesex 1,300 699 18 10 Example for Corn = 4,637 ac / 73 farms = 64 acres of corn in the Composite Farm (CF) 0 (D) (D) (D) Capitalization Rate Middlesex 5,843 (D) 80 0 (D) 23 3,183 44 Soil Index Middlesex (-) 3,183 (-) 44 12,502 172 Use-value Estimates Middlesex
Income Approach Crop Budgets Ag Census Middlesex Created for all CF crops Based on VCE enterprise budget format Yields and Prices -> NASS Seeding and lime rates > VCE recommendation N,P, & K inputs are based on yield- driven nutrient removal rates (International Plant Nutrition Institute) AgFrist -> short-term interest Composite Farm Middlesex Crop Budgets Middlesex Federal Payments Middlesex Capitalization Rate Middlesex Soil Index Middlesex Use-value Estimates Middlesex
Income Approach Crop Budgets Ag Census Middlesex Pesticides -> Pest Management Guidelines (PMG) Application costs > custom rates Machinery usage and costs -> A. Society of Ag and Biological Engineers equations Fuel prices -> U.S. Dept of Energy Crop insurance -> USDA-RMA Labor hours function of machinery hours Labor rate -> NASS Note: Budgeted Net Returns lag 2 years, e.g., Tax Year 2018 reflects 2016 data Composite Farm Middlesex Crop Budgets Middlesex Federal Payments Middlesex Capitalization Rate Middlesex Soil Index Middlesex Use-value Estimates Middlesex
Example Budget Middlesex Corn Grain no-till TY2018 Corn: Yield = 147.5 bu/ac * Price = $3.75/bu = $553.13 Net Crop Insurance = $44.74 Income Approach Ag Census Middlesex Composite Farm Middlesex Total Income = $597.87 Crop Budgets Middlesex Federal Payments Middlesex Net Returns = Income - Costs Pre-Harvest Costs: N 144 Lb Price = $0.44/lbs = $63.28/ac Capitalization Rate Middlesex Harvest Costs: Labor, fuel & oil, drying, hauling = $77/ac NR = $598 - $535 = $63/ac Soil Index Middlesex Fixed Costs: Machinery and Overhead = $83/ac Use-value Estimates Middlesex Total Costs = $535/ac
Income Approach Olympic Averaging Ag Census Middlesex The Net Return for each CF crop requires 7 - years of crop budgets 7-year Olympic Averaging drops the highest and lowest values and then straight averages the remaining 5 values Middlesex Corn Grain example 2012- 2018 Composite Farm Middlesex Crop Budgets Middlesex Federal Payments Middlesex Capitalization Rate Middlesex Corn Crop Budget Highest TY2012 TY2013 TY2014 TY2015 TY2016 TY2017 TY2018 Olympic AVG $86.76 $339.57 $303.19 $134.23 $18.91 $114.43 $62.52 $157.89 Soil Index Middlesex Lowest Use-value Estimates Middlesex
Income Approach Federal Payments Ag Census Middlesex USDA-FSA providesdatafor program crops by county Middlesex receives payments for corn, soybeans, and wheat. Annual payments = Payment/crop acreage For example in TY2018, Middlesex received $23,646 in federal payments for corn. TY2017 $163,626.54/8,239 ac = $19.86/ac TY2018 $23,645.93/8,239 ac = $2.87/ac Composite Farm Middlesex Crop Budgets Middlesex Federal Payments Middlesex Capitalization Rate Middlesex Soil Index Middlesex Use-value Estimates Middlesex
Income Approach Olympic Averaging Ag Census Middlesex Middlesex Corn Grain example 2012-2018 Federal Payment $14.53 $25.40 $25.67 $31.82 Corn Budget Composite Farm Middlesex Corn TY2012 TY2013 TY2014 TY2015 TY2016 TY2017 TY2018 Olympic AVG $86.76 $339.57 $303.19 $134.23 $18.91 $114.43 $62.52 $140.23 Highest Crop Budgets Middlesex Federal Payments Middlesex Highest Lowest Lowest $0.00 $19.86 $2.87 $17.67 Capitalization Rate Middlesex Corn Net Return for TY2018 Oly AVG Fed Pay + Oly AVG Budget $17.67 + $140.23 = $157.89 Soil Index Middlesex Use-value Estimates Middlesex
Income Approach Middlesex Crop Budgets and Federal Payments Tax Years 2010-2018 Ag Census Middlesex OLY AVG 2018 2017 2016 2015 2014 2013 2012 Composite Farm Middlesex Corn $62.52 $114.43 $18.91 $134.23 $303.19 $339.57 $86.76 $140.23 $2.87 $19.86 $0.00 $31.82 $25.67 $25.40 $14.53 $17.67 Fed Pay Total $157.89 Hay -$16.92 -$34.68 -$157.37 -$163.99 -$12.09 -$23.39 -$46.16 $0.00 Crop Budgets Middlesex Federal Payments Middlesex Pasture $22.89 $40.53 -$40.27 -$16.18 $76.64 $30.57 -$6.17 $18.80 Capitalization Rate Middlesex Soybean $79.08 $59.10 $106.52 $175.54 $318.04 $245.41 $172.06 $155.72 Fed Pay $31.73 $19.86 $0.00 $12.72 $16.47 $15.82 $9.39 $14.85 Total $170.57 Soil Index Middlesex Wheat $7.03 $42.94 $21.85 $75.90 $162.62 $173.70 $68.06 $74.27 Fed Pay $19.87 $19.86 $0.00 $19.39 $25.72 $25.57 $14.94 $19.93 Total $94.20 Use-value Estimates Middlesex Final Net Return (Weighted AVG) $163.32
Income Approach Final Net Returns Middlesex County TY2018 Ag Census Middlesex Composite Farm weighted NR by crop acreage Composite Farm Middlesex Crop Budgets Middlesex Federal Payments Middlesex Estimated Net Return CF acres Weight Crop Final$ (e.g. corn 64/172=0.37) Corn Hay Pasture $157.89 $0.00 $18.80 0.37 0.10 0.06 64 18 10 $58.56 $0.00 $1.05 Capitalization Rate Middlesex Soybeans $170.57 0.47 80 $79.72 Soil Index Middlesex Wheat $94.20 0.26 44 $23.98 Final Net Return (per acre) $163.32 172 Use-value Estimates Middlesex Reflects double-cropped wheat (44 ac)
Income Approach Capitalization Rate Why use Capitalization Rate? Cap Rate = Net Return Value Farmland Farmland Value = NR Cap Rate $100 per year 10% = $1,000 Cap Rate = Interest Rate + Property Tax Ag Census Middlesex Composite Farm Middlesex Crop Budgets Middlesex Federal Payments Middlesex Capitalization Rate Middlesex Effective Tax Rates for all counties - VA Department of Taxation (10 year average) Federal Land Bank long term interest rate - AgFirst (10 year average) Soil Index Middlesex Use-value Estimates Middlesex
Income Approach Middlesex TY2018 Cap Rate Components Ag Census Middlesex Interest Rate statewide (10yr Avg) 0.0584 Composite Farm Middlesex Property Tax Middlesex (10yr Avg) 0.0039 Total without risk 0.0623 Crop loss due to Flooding 5% 0.0031 Crop Budgets Middlesex Federal Payments Middlesex Total With risk 0.0654 Capitalization Rate Middlesex Use Value Middlesex TY2018 Use Value = Net Returns Cap Rate Use Value without risk = $163.32 0.0623 Soil Index Middlesex Use Value without risk = $2,622.73 Use Value with risk = 0.0654 $163.32 Use-value Estimates Middlesex Use Value with risk = $2,497.84
Income Approach Adjustments for Soil Capabilities Ag Census Middlesex USDA Land Classes for Ag use Productivity Index Composite Farm Middlesex Land Capability Classes Class I - Excellent cropland 1.50 Class II - Good cropland Crop Budgets Middlesex Federal Payments Middlesex 1.35 Class III - Average cropland 1.00 Class IV - Below average cropland strip cropping only, hay Class V Good Pasture, hay 0.80 Capitalization Rate Middlesex 0.60 Class VI Pasture 0.50 Soil Index Middlesex Class VII Very limiting - Pasture only 0.30 Class VIII Not suitable to agriculture steep or wet 0.10 Use-value Estimates Middlesex
Income Approach Indexing for Soil Productivity Ag Census Middlesex Middlesex Reported Acreage 3,223 14,164 453 1,634 0 157 520 20,154 Productivity Index 1.5 1.35 1 0.8 0.6 0.5 0.3 Land Class 1 2 3 4 5 6 7 Weighted Acreage 4,834.41 19,120.91 452.80 1,310.53 Composite Farm Middlesex Crop Budgets Middlesex Federal Payments Middlesex 0.00 78.51 155.85 25,953 Capitalization Rate Middlesex Total Soil Index Middlesex Soil Index Factor 25,953 20,154 = 1.288 Use-value Estimates Middlesex
Income Approach Adjusting to Class III land Ag Census Middlesex Why? Data reflects average soil productivity for each county Values are adjusted to reflect Class III productivity Composite Farm Middlesex Crop Budgets Middlesex Federal Payments Middlesex Use Value Middlesex TY2018 Use Value = Use Value Soil index Capitalization Rate Middlesex Without risk = $2,622.73 1.288 Without Risk Class III = $2,036.71 With risk $2,497.84 1.288 Soil Index Middlesex With Risk Class III = $1,939.72 Use-value Estimates Middlesex
Final Estimates Middlesex TY2018 Weighted Pasture land AVG Weighted Cropland AVG Weighted Ag. Land AVG Cropland Pastureland I II III IV I-IV V VI VII V-VII I-VII VIII w/out Risk w/ Risk 3,060 2,910 2,750 2,620 2,040 1,940 1,630 1,550 2,690 2,560 1,220 1,160 1,020 970 610 580 710 670 2,620 2,500 200 190 Note: Final estimated values are rounded to the nearest $10 The Class III w/out risk estimate of $2,036.71 is reported as $2,040
Rental Rate Approach Middlesex TY2018 Starting 2009 NASS published rental rate data annually* for Cropland Irrigated cropland Pasture land Middlesex County rental rates for TY2018 (NASS) Cropland = $1,020 Eastern District (Combined County) Pastureland = not published *Sometimes biennially based on NASS funding
Rental Rate Use Value Middlesex TY2018 Rental Rate Cap Rate = $63.501 Not Published Value Cropland Pasture 0.0623 = $1,020 1Eastern District Cropland combined county Rental Rate Estimates are published annually not averaged over time
Income Approach and Rental Rate Approach: Compared Rental Rate Approach Cropland Income Middlesex Approach (w/out risk) Cropland (I-IV AVG) TY2018 $2,690 $1,020 Pastureland (V-VII AVG) Pastureland $710 ---
Rental Rates TY2018 Table 1: 2016 cropland and pastureland values based on NASS1capitalized rental rates ----- Pastureland ----- - Rental Rate $/acre1 24 -- -- -- ------- Cropland -------- Irrigated cropland Capitalization Rate2 Jurisdictions Counties Rental Rate $/acre1 58 77 66 63.5ec 75 75 72 Value $/acre3 894 1,184 1,005 1,020 1,207 1,178 1,150 ec Eastern District Cropland (Combined Counties) Rental Rate $/acre1 -- -- -- -- -- -- -- Value $/acre3 -- -- -- -- -- -- -- Value $/acre3 370 -- -- -- Caroline Essex King William Middlesex Northumberland Richmond Westmoreland 0.0649 0.0651 0.0657 0.0623 0.0622 0.0636 0.0626 -- -- -- --
Use-value Estimates: Type III Land (w/out risk) Selected Jurisdiction Comparison (Tax Years 2009 to 2018) Caroline Essex 2,400 King William 2,200 Middlesex 2,000 1,800 Northumberland 1,600 Richmond $/acre 1,400 Westmoreland 1,200 1,000 800 600 400 200 0 2009 2010 2011 2012 2013 2014 2015 2016 2017 2018 Tax Year
Real Net Farm Income Virginia $/farm (Index 2009=100) $30,000 $25,000 $20,000 $15,000 $10,000 $5,000 $- Source: USDA/ERS Farms and Land in Farms and USDA/ERS Farm Income and Wealth Statistics
Surrounding Counties Deferred Values? Deferred Value$1 (Total FMV minus Total Taxable FMV $190,532,636 $135,888,968 $121,456,400 $77,571,000 $165,184,122 $70,484,863 $135,730,850 % of Deferred Value of Total FMV 7.33% 10.75% 7.98% 3.56% 5.81% 8.84% 5.53% County Reporting Year 2016 2016 2016 2016 2016 2016 2016 Caroline Essex King William Middlesex Northumberland Richmond Westmoreland 1 Deferred Values are Virginia Department of Taxation (Annual Reports Fiscal Year 2016) https://www.tax.virginia.gov/annual-reports
Thanks! & Discussion & Questions? usevalue.agecon.vt.edu


")