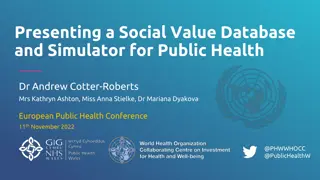
Using SROI as an Assessment Tool for NRN Activities
Learn about the Social Return on Investment (SROI) method as an assessment tool for activities within the NRN. Understand the main elements of SROI, measuring impact of outcomes, and creating impact maps to evaluate effectiveness and benefits. Explore case studies and discussions on implementing this approach.

Download Presentation

Please find below an Image/Link to download the presentation.
The content on the website is provided AS IS for your information and personal use only. It may not be sold, licensed, or shared on other websites without obtaining consent from the author. If you encounter any issues during the download, it is possible that the publisher has removed the file from their server.
You are allowed to download the files provided on this website for personal or commercial use, subject to the condition that they are used lawfully. All files are the property of their respective owners.
The content on the website is provided AS IS for your information and personal use only. It may not be sold, licensed, or shared on other websites without obtaining consent from the author.
E N D
Presentation Transcript
SROI as an assessment tool for NRN activities John Powell and Katarina Kubinakova, CCRI with Richard Madin, BNED LEADER
Introduction Overview of the SROI method Example terminology Case Studies Richard Madin Activity 1 Outputs and Outcomes Activity 2 indicators Activity 3 proxies Putting it all together the impact map Discussion on application of the approach
Main elements of SROI A framework drawn from social accounting and Cost Benefit Analaysis for understanding the effectiveness of spending SROI i.e. 1:3 = Value of benefits Investment Triple bottom line economic, social and environmental Outcomes-based evaluation Can be evaluative (ex-post) and/or forecast (ex-ante)
Measuring impact of outcomes Computation of the outcome incidence: No. of beneficiaries * Indicator value Taking into account: Deadweight Attribution Displacement Discounting future benefits
Impact map Stakeholder (Scoping/PT) Input (Scoping PT/CS) Activity (PT/CS) Output (PT/CS) Outcome (PT) Disadvantaged groups Time Trained in IT skills Number of hours engaged Level of IT skills -Increased self confidence -Increased social participation -Sustainable employment -Improved employability Business community Time / match funding Developing new product markets Processing Adding value Number of business beneficiaries No. of jobs created/safeguarded -Income and employment effects on local economy -Improved sustainability of local businesses Rural community dwellers Projects to improve basic services Improved infrastructure No. of beneficiaries of new services No jobs created/safeguarded -Access to wider range of services Improved quality of life and well-being Central Government Grant funding Assessing and approving projects Monitoring Number of projects supported Jobs created and/or retained Reduced expenditure on welfare Increased tax take Voluntary & Community sector Time Projects to improve services and engage community Number of hours volunteering Jobs created through improved services -Increased community participation
Impact map (Continued) Outcome (From PT) Indicator (From CS interview) Proxy (CS Interview / secondary data) Deadweight Attribution displacement (From CS interview) Drop-off (% decline per year) (Interview/sens itivity analysis) Present Value (Discount rate 3.5%) And computation of SROI ratio -Increased self confidence -Increased social participation -Sustainable employment -Improved employability Self reporting of self confidence and employment prospects DW 0.3 AT 0.2 DP 0.0 0.25 Annual 3.5% -Income and employment effects on local economy -Improved sustainability of local businesses -Extent of local sourcing -no of businesses predicting growth over next 5 years Multiplier estimates from academic literature -Improved quality of life and well-being Self reporting of various QOL and WB measures (i.e. life satisfaction) Reduced expenditure on welfare Increased tax take Estimates of state expenditure -Increased community participation No of residents reporting greater community integration
Valuation under SROI A form of social accounting - monetisation allows the significance of outcomes to be compared. Enables exploration of a wide range of programme outcomes rather than ignoring those which cannot easily be expressed in money terms
The SROI approach where does it fit in the NRN logic? SROI based assessment NRN Programme needs Contribution Actual stakeholder outcomes Values Overall NRN objectives Impacts NRN specific objectives Indicators Results NRN operational objectives Outputs NRN Action
Framework construction Stakeholder /beneficiary type No. beneficiaries & grant size (England) Outcome incidence (Indicator value*No beneficiaries Incidence after deadweight, attribution and displacement Total Annual value produced (Proxy* attributable incidence) Present Value (Sum of 5 year values; drop off 20% p.a / Discount rate 3.5%)
Example financial proxies for Axis 3 outcomes Outcome Increase in farm incomes and income sources through diversification; Financial proxy Value of increased and safeguarded sales arising from agricultural diversification through LEADER Contribution to local economy through restoration and management of farm buildings Earnings differential of moving to a level 2 NVQ qualification Unit per farm business Value 1,099 Increased levels of restoration and maintenance of historic farm buildings per farm 1617 Development of skills for farmers and farm workers pp pa 1456
Principles of SROI SROI explores, measures, and values change Stakeholder driven and focused on outcomes It values the things that matter It tries not to over-claim It is based on transparency Where possible - results are verified


")