Using Open-Source Optimization Tool for Last-Mile Distribution in Zambia

undefined
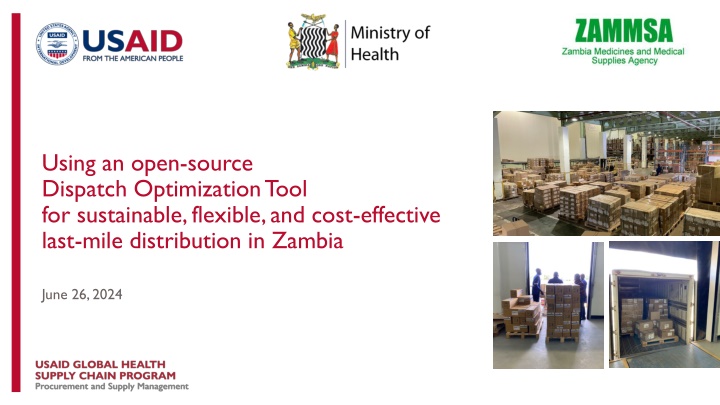
Using an open-source
Dispatch Optimization Tool
for sustainable, flexible, and cost-effective
last-mile distribution in Zambia
June 26, 2024
Introductions                                 Agenda
Opening Remarks
o
Kevin Pilz (USAID)
Experience Using the Dispatch
Optimization Tool (DOT) in Zambia
o
Bruce Kamuti (ZAMMSA)
Demo of DOT App and Other Use Cases
o
Eileen Patten (GHSC-PSM)
Q&A
Technical Demo: How to Get Started with
GitHub Download and DOT Templates
o
Eileen Patten (GHSC-PSM)
2
 
3
 
Experience Using DOT
in Zambia
Bruce Kamuti, ZAMMSA
Background:
 
 Why is a 
Dispatch Optimization
 Tool Needed?
 
4
 
What Problems Does the Dispatch Optimizer Solve?
 
5
 
Reduce cost and time of deliveries while maintaining service
standards by dynamically optimizing delivery routes.
Why 
Dynamic 
Route Optimization?
 
6
 
Using set routes planned with or
without the use of route
optimization software
Even if routes are mathematically
optimized, they are done so for
one static scenario and reused
under changing circumstances
This makes it difficult to manage
changing volumes, late orders,
changing circumstances
This is what most countries do
today, but there is now the
ability to do better.
Software like the Dispatch Optimizer can allow rapid dynamic
adjustments based on changing circumstances and uncertainty
Can adjust to variability in orders (e.g., different commodity
types, quantities, seasonal patterns)
Can adjust to changes in vehicle and driver availability
Can optimize late orders separately to find the most efficient
dispatch plans while not delaying the on-time orders
Can adjust as a rainy season impacts accessibility (e.g., split
truck routes onto smaller 4x4 SUVs, remove inaccessible
facilities)
Open-source software and improving data and IT
landscapes have opened options that used to be
accessible primarily to corporations able to purchase
costly software licenses.
Dynamic Route Optimization
Static Route Planning    vs.
Example:  Why Relying on Static Routes is Problematic
 
7
 
Volumes for the three routes
shown in the chart on the right
increased dramatically from the
requisition in March 2023 to the
one in May 2024.
This increase occurred due to
stock levels improving enabling
ZAMMSA to fulfill more of the
orders that are received – from a
40-50% order fill rate up to 80%
from 2023 to 2024.
The number of trucks required
increased from just 3 to 17 and the
total tonnage of trucks needed
increased from just 55T to 325T
A Successful Roll-out in Zambia
 
8
 
Engagement with local stakeholders
ZAMMSA collaborated with USAID’s GHSC-PSM project and their
3PLs in Lusaka to coordinate efforts for the application and business
processes
User-focused design tailored to public health
supply chains
App developers spent time embedded in ZAMMSA central medical
warehouse and 2 hubs, observing operations and collecting
requirements for an operational route optimization application
Ongoing and expanding operational use
ZAMMSA staff use the tool weekly, with all regional hubs and about
2,135 last-mile health facilities in Zambia currently receiving deliveries
planned using this tool; currently active in 4 hubs and working on
expansion to every hub in the country
DOT being run in
ZAMMSA Lusaka
warehouse on
October 1, 2021
First optimized
dispatch leaving
Mansa hub on
June 3, 2022
Transforming Transportation and Warehouse Planning
 
9
 
Transportation planning was done manually,
using guess work based on prior experience
Sometimes delivered to the same facility on
multiple routes for different commodities
Warehouse sometimes staged orders and the
truck was too small or unnecessarily large
Consistently increasing commodity categories
and volumes in Zambia was making reliance
on prior experience risky
Data-driven decision making that is flexible to
changing circumstances
Reduced instances of multiple dispatches to
the same facility
Volumetrics and optimized vehicles ensure
the best vehicles are planned for each load
Transportation planners are well prepared to
respond to changing or increasing order
volumes, even during health crises
BEFORE
AFTER
Other benefits: Reduced costs
 
and carbon emissions; increased
customer satisfaction and employee/3PL coordination
DOT’s Impact Beyond Transportation Planning
10
 
DOT outputs are not just used by distribution planner but by all functions preparing for distribution in
the warehouse
Runs DOT &
Produces Loading
Plan
Shares
with…
Plans Pick Waves
based on dispatch order
 Wave Planner
Customer Service
Informs Customers of Upcoming
Deliveries and Gathers Feedback
Schedules trucks to arrive based on lead time needed to prepare orders and dock door availability
Picking, Packing, Staging according
to loading plan and schedule
Load and Dispatch at 7 Dock Doors
Loading
Plan
3PL Manager
Generates Purchase Orders (POs)
and coordinates w 3PL providers
Distribution
Planner
undefined
Eileen Patten, GHSC-PSM
Demo of Dispatch Optimization Tool
App & Other Use Cases
Collaborating with and Contributing to Open-Source Technology
Tool built on top of open-source
tools, as shown in the image to the
left
Deployed on Azure cloud and
users access it like any website
Source code is available for
download on GitHub
Tool can be adapted for other
types of health commodity
distribution or service delivery,
such as for community health
workers conducting home visits
https://github.com/ghsc-psm/Dynamic-Optimization-Routing
12
How to Use the Dispatch Optimizer Tool
13
The Dispatch Optimizer Application
Route maps, details
and KPIs can be
viewed on the
interactive website
Or downloaded in
Excel for manual
modifications,
additional analysis,
or sharing plans
with warehouse staff
and suppliers.
14
June 2022
Based on the
initial success, the
tool was adapted
and rolled out in
Luanshya and
Mansa, Zambia.
July 2022
The app was tested
in Kenya, including
developing new
features to address
country-specific
needs.
October 2021
The Dispatch
Optimizer was
launched in
Zambia’s central
medical
warehouse in
Lusaka.
Early 2020
A proof of concept
was developed by
USAID GHSC-PSM
in Excel and tested
in Haiti.
The footprint and features continue to
grow, as other countries actively seek to
learn from Zambia’s example and adopt
the tool.
2024 and Beyond
Zambia expanded to two
new hubs this year and is
planning three more by
the end of 2025.  New
features are improving
use.
Mali conducted research
with the tool and is
looking towards
implementation.
15
How Can You Get Started With Dynamic Routing?
Why: Greater flexibility, greater coordination, greater efficiency! Can also test impact of changes to
fleet, distribution patterns, etc.
Code and Templates for the Dispatch Optimization Tool are all available on the GHSC-PSM GitHub
What You Need:
List of facilities and their geocoordinates
Details on fleet sizes and cost structures
Distance matrix capturing distances and times between all facilities
Order Details at the Facility Level
We have a small amount of budget available for Technical Assistance if you want to get started or have
questions about the Git repo – reach out to Kevin Pilz and Eileen Patten
During the section after the Q&A I’ll walk you through the initial steps to download the app and
review the templates required
16
Want to Learn More? Visit the
QR Code on the Screen to…
Questions?
Comments?
Thoughts?
17
undefined
Eileen Patten, GHSC-PSM
Technical Demo:
How to 
Get Started 
with 
GitHub
Download
 and DOT Templates
undefined
Backup Slides
User-Friendly Web App Interface Offers Ease and Flexibility
20
Review the order
data and de-select
facilities if
needed
Upload the order
data—which
facilities need
what deliveries?
Tool Uses Google’s ORTools to Solve Optimization Problem
21
Refine the problem by selecting vehicle
availability and other restrictions
Can certain trucks not deliver to certain
facilities?
Set additional parameters and run
the model
Will return leg be priced into
cost?
Should the weight limits of the
vehicles be considered?
Kenya Experience – Q4 FY22:
Assessing Feasibility of Dispatch Optimization
Conducting the exercise allowed MEDS to
better understand 3PL practices, including the
use of hubs for last-mile dispatch
We conducted both a hub optimization and last-
mile route optimizations from each proposed
hub to enable planning for a last-mile strategy
Research was based on 2 typical orders – one
TO1 order including 1941 facilities across 46
counties and 8 commodities and one TO2 LLIN
order including 243 facilities across 3 counties
Tool was handed off to MEDS in early 2023 with
caveat that additional development would be
needed to make it operationally feasible, as it
was developed for a desk review
Hub optimization
22
Hub Optimization Results
23
Attempting LMD will require coordination with or
establishment of hubs throughout country – routes
from Nairobi central warehouse (WH) to last mile is
not practical given size of country
Model selected 13 hubs + Nairobi central WH
Between 6 (Marsabit) and 210 (several) facilities
assigned to each hub
Total network distance = 125,766km
*
589,613km if all ran direct from Nairobi WH
Avg. hub-to-last-mile distance = 65km
*
304km if all ran direct from Nairobi WH
Dispatch Optimization: Nairobi to Hub Routes (TO1)
Facilities Receiving 2 Deliveries
24
14 total dispatches; 4,900 km one way
Trucks: 57% 13T, 14% 4T, 7% 2T, 21% 1T
1 police escort
3 multi-day routes
Total costs (ksh): 2.95M
10,200 per m
3
; 598 per km
Average utilization
: 83%
Dispatch Optimizations: Hub to Last-Mile HFs (TO1)
Click on thumbnails to access interactive map
25
Bungoma
Embu
Garissa
Homa Bay
Kisii
Lamu
Machakos
Marsabit
Mombasa
Nairobi
Nakuru
Narok
Siaya
Lamu
Turkana
Comparing TO1 to LLIN for One Hub:  Homa Bay
TO1
LLINs
2 hub trips from Nairobi
Total of 115 facilities and 45m
3
Last-mile routes: 301,900ksh
o
7,340ksh per m
3
o
308 per km
o
2,630ksh per drop
26
2 hub trips from Nairobi
Total of 210 facilities and 38.5m
3
Last-mile routes: 544,300ksh
o
14,160ksh per m
3
o
322 per km
o
2,590 per drop
New Features Added to the LMD Application Code Base
Several features were added to the Distance Matrix and DOT tools during the Kenya exercise. These can
now be utilized in future projects utilizing this tool.
1.
We 
generalized the tool from a Zambia-specific product 
to be more flexible and scalable for use cases in other
countries.
2.
We developed a process to load a set of pre-determined routes or regions into the DOT for 
optimizing historical
or region-confined routes
3.
We developed a 
batch run process 
that allows you to set up several optimizations to run successively for
overnight/weekend runs
4.
We added a feature to 
re-optimize vehicle assignments 
after optimization in case of sub-optimal initial
assignments
5.
We added a feature to allow for easy 
download of interactive route maps 
from optimizations
6.
We 
updated the process to generate distance matrices 
to accommodate rural facilities on islands and non-
major roads and made it easier to generate vehicle-location restrictions
27
Mali Experience - Ongoing:
Using Kobo Surveys to Update Geodata and Plan for LMD
Phase 1
Collecting Data to Enable LMD Analysis
2 regions included in project – Kayes and
Koulikoro
Initial data collection using KoboToolbox
handheld devices 
(
https://www.kobotoolbox.org/
)
Gathering geocoordinates, facility details (e.g.,
max vehicle capacity), and road network
information via GPS tracking and surveys
Road network data was then loaded into
OpenStreetMaps
Small-scale POC of LMD analysis presented
Phase 2
Facility Mapping and LMD Analysis
Preparing a website to present all the survey
and geodata that has been collected
Using this data to generate a representative
optimized route plan
Help MoH see how they might transition from
current model (facilities each come to district
warehouse to collect commodities) to a
potential future state (optimized routes to
dispatch to last mile)
Expected completion: mid- to late Nov
28
Slide Note
Embed
Share

Explore the utilization of an open-source Dispatch Optimization Tool (DOT) for sustainable, flexible, and cost-effective last-mile distribution in Zambia. The tool aims to reduce costs, optimize delivery routes dynamically, and enhance efficiency in supply chain management. Learn about the benefits, experience of users, and the need for dynamic route optimization in the context of changing circumstances and uncertainties faced in distribution operations.

  • Optimization Tool
  • Last-Mile Distribution
  • Zambia
  • Supply Chain Management
  • Dynamic Route Optimization

Uploaded on Jul 01, 2024 | 2 Views


Download Presentation

Please find below an Image/Link to download the presentation.

The content on the website is provided AS IS for your information and personal use only. It may not be sold, licensed, or shared on other websites without obtaining consent from the author. Download presentation by click this link. If you encounter any issues during the download, it is possible that the publisher has removed the file from their server.

E N D

Presentation Transcript


  1. Using an open-source Dispatch OptimizationTool for sustainable, flexible, and cost-effective last-mile distribution in Zambia June 26, 2024 Photo: Lan Andrian

  2. Introductions Agenda Opening Remarks o Kevin Pilz (USAID) Experience Using the Dispatch Optimization Tool (DOT) in Zambia o Bruce Kamuti (ZAMMSA) Demo of DOT App and Other Use Cases o Eileen Patten (GHSC-PSM) Q&A Technical Demo: How to Get Started with GitHub Download and DOT Templates o Eileen Patten (GHSC-PSM) USAID GLOBAL HEALTH SUPPLY CHAIN PROGRAM-Procurement and Supply Management 2

  3. ZAMMSA Experience Using DOT in Zambia Bruce Kamuti, ZAMMSA Innovation Reliability Efficiency Respect Integrity OUR USAID GLOBAL HEALTH SUPPLY CHAIN PROGRAM-Procurement and Supply Management VALUES Transparency 3 Teamwork Accountability Client Centeredness Environmentally Friendly

  4. ZAMMSA Background: Why is a Dispatch Optimization Tool Needed? Innovation Reliability Efficiency Respect Integrity OUR USAID GLOBAL HEALTH SUPPLY CHAIN PROGRAM-Procurement and Supply Management VALUES Transparency 4 Teamwork Accountability Client Centeredness Environmentally Friendly

  5. ZAMMSA What Problems Does the Dispatch Optimizer Solve? Reduce cost and time of deliveries while maintaining service standards by dynamically optimizing delivery routes. Innovation Reliability Efficiency Respect Integrity OUR USAID GLOBAL HEALTH SUPPLY CHAIN PROGRAM-Procurement and Supply Management VALUES Transparency 5 Teamwork Accountability Client Centeredness Environmentally Friendly

  6. ZAMMSA Why Dynamic Route Optimization? Static Route Planning vs. Dynamic Route Optimization Software like the Dispatch Optimizer can allow rapid dynamic adjustments based on changing circumstances and uncertainty Can adjust to variability in orders (e.g., different commodity types, quantities, seasonal patterns) Can adjust to changes in vehicle and driver availability Can optimize late orders separately to find the most efficient dispatch plans while not delaying the on-time orders Can adjust as a rainy season impacts accessibility (e.g., split truck routes onto smaller 4x4 SUVs, remove inaccessible facilities) Open-source software and improving data and IT landscapes have opened options that used to be accessible primarily to corporations able to purchase costly software licenses. Using set routes planned with or without the use of route optimization software Even if routes are mathematically optimized, they are done so for one static scenario and reused under changing circumstances This makes it difficult to manage changing volumes, late orders, changing circumstances This is what most countries do today, but there is now the ability to do better. Innovation Reliability Efficiency Respect Integrity OUR USAID GLOBAL HEALTH SUPPLY CHAIN PROGRAM-Procurement and Supply Management VALUES Transparency 6 Teamwork Accountability Client Centeredness Environmentally Friendly

  7. ZAMMSA Example: Why Relying on Static Routes is Problematic Loading Plans: Trucks Needed 8 total Volumes for the three routes shown in the chart on the right increased dramatically from the requisition in March 2023 to the one in May 2024. 20T*7 + 15T*1 7total 2023 2024 20T*6 + 10T*1 8 7 6 This increase occurred due to stock levels improving enabling ZAMMSA to fulfill more of the orders that are received from a 40-50% order fill rate up to 80% from 2023 to 2024. 5 2 total 20T 4 1 total 20T 3 1 total 20T 1 total 15T 2 1 The number of trucks required increased from just 3 to 17 and the total tonnage of trucks needed increased from just 55T to 325T 0 Lusaka 4 Lusaka 5 Lusaka 6 Innovation Reliability Efficiency Respect Integrity OUR USAID GLOBAL HEALTH SUPPLY CHAIN PROGRAM-Procurement and Supply Management VALUES Transparency 7 Teamwork Accountability Client Centeredness Environmentally Friendly

  8. ZAMMSA A Successful Roll-out in Zambia Engagement with local stakeholders ZAMMSA collaborated with USAID s GHSC-PSM project and their 3PLs in Lusaka to coordinate efforts for the application and business processes User-focused design tailored to public health supply chains App developers spent time embedded in ZAMMSA central medical warehouse and 2 hubs, observing operations and collecting requirements for an operational route optimization application DOT being run in DOT being run in ZAMMSA Lusaka ZAMMSA Lusaka warehouse on warehouse on October 1, 2021 October 1, 2021 Ongoing and expanding operational use ZAMMSA staff use the tool weekly, with all regional hubs and about 2,135 last-mile health facilities in Zambia currently receiving deliveries planned using this tool; currently active in 4 hubs and working on expansion to every hub in the country First optimized First optimized dispatch leaving dispatch leaving Mansa hub on Mansa hub on June 3, 2022 June 3, 2022 Innovation Reliability Efficiency Respect Integrity OUR USAID GLOBAL HEALTH SUPPLY CHAIN PROGRAM-Procurement and Supply Management VALUES Transparency 8 Teamwork Accountability Client Centeredness Environmentally Friendly

  9. ZAMMSA Transforming Transportation and Warehouse Planning AFTER BEFORE Data-driven decision making that is flexible to changing circumstances Reduced instances of multiple dispatches to the same facility Volumetrics and optimized vehicles ensure the best vehicles are planned for each load Transportation planners are well prepared to respond to changing or increasing order volumes, even during health crises Transportation planning was done manually, using guess work based on prior experience Sometimes delivered to the same facility on multiple routes for different commodities Warehouse sometimes staged orders and the truck was too small or unnecessarily large Consistently increasing commodity categories and volumes in Zambia was making reliance on prior experience risky Other benefits: Reduced costs and carbon emissions; increased customer satisfaction and employee/3PL coordination Innovation Reliability Efficiency Respect Integrity OUR USAID GLOBAL HEALTH SUPPLY CHAIN PROGRAM-Procurement and Supply Management VALUES Transparency 9 Teamwork Accountability Client Centeredness Environmentally Friendly

  10. ZAMMSA DOT s Impact Beyond Transportation Planning DOT outputs are not just used by distribution planner but by all functions preparing for distribution in the warehouse Picking, Packing, Staging according to loading plan and schedule Wave Planner Plans Pick Waves based on dispatch order Load and Dispatch at 7 Dock Doors Distribution Planner Loading Plan Customer Service Informs Customers of Upcoming Deliveries and Gathers Feedback Shares with 3PL Manager Generates Purchase Orders (POs) and coordinates w 3PL providers Runs DOT & Produces Loading Plan Schedules trucks to arrive based on lead time needed to prepare orders and dock door availability Innovation Reliability Efficiency Respect Integrity OUR USAID GLOBAL HEALTH SUPPLY CHAIN PROGRAM-Procurement and Supply Management VALUES Transparency 10 Teamwork Accountability Client Centeredness Environmentally Friendly

  11. Demo of Dispatch Optimization Tool App & Other Use Cases Eileen Patten, GHSC-PSM Photo: Lan Andrian

  12. Collaborating with and Contributing to Open-Source Technology Tool built on top of open-source tools, as shown in the image to the left Deployed on Azure cloud and users access it like any website Source code is available for download on GitHub Tool can be adapted for other types of health commodity distribution or service delivery, such as for community health workers conducting home visits https://github.com/ghsc-psm/Dynamic-Optimization-Routing USAID GLOBAL HEALTH SUPPLY CHAIN PROGRAM-Procurement and Supply Management 12

  13. How to Use the Dispatch Optimizer Tool USAID GLOBAL HEALTH SUPPLY CHAIN PROGRAM-Procurement and Supply Management 13

  14. The Dispatch Optimizer Application Route maps, details and KPIs can be viewed on the interactive website Or downloaded in Excel for manual modifications, additional analysis, or sharing plans with warehouse staff and suppliers. USAID GLOBAL HEALTH SUPPLY CHAIN PROGRAM-Procurement and Supply Management 14

  15. The footprint and features continue to grow, as other countries actively seek to learn from Zambia s example and adopt the tool. 2024 and Beyond October 2021 Early 2020 June 2022 July 2022 Zambia expanded to two new hubs this year and is planning three more by the end of 2025. New features are improving use. The Dispatch Optimizer was launched in Zambia s central medical warehouse in Lusaka. A proof of concept was developed by USAID GHSC-PSM in Excel and tested in Haiti. Based on the initial success, the tool was adapted and rolled out in Luanshya and Mansa, Zambia. The app was tested in Kenya, including developing new features to address country-specific needs. Mali conducted research with the tool and is looking towards implementation. 15 USAID GLOBAL HEALTH SUPPLY CHAIN PROGRAM-Procurement and Supply Management

  16. How Can You Get Started With Dynamic Routing? Why: Greater flexibility, greater coordination, greater efficiency! Can also test impact of changes to fleet, distribution patterns, etc. Code and Templates for the Dispatch OptimizationTool are all available on the GHSC-PSM GitHub What You Need: List of facilities and their geocoordinates Details on fleet sizes and cost structures Distance matrix capturing distances and times between all facilities Order Details at the Facility Level We have a small amount of budget available for Technical Assistance if you want to get started or have questions about the Git repo reach out to Kevin Pilz and Eileen Patten During the section after the Q&A I ll walk you through the initial steps to download the app and review the templates required USAID GLOBAL HEALTH SUPPLY CHAIN PROGRAM-Procurement and Supply Management 16

  17. Want to Learn More? Visit the QR Code on the Screen to Questions? Comments? Thoughts? USAID GLOBAL HEALTH SUPPLY CHAIN PROGRAM-Procurement and Supply Management 17

  18. Technical Demo: How to Get Started with GitHub Download and DOT Templates Eileen Patten, GHSC-PSM Photo: Lan Andrian
Related


More Related Content

giItT1WQy@!-/#giItT1WQy@!-/#giItT1WQy@!-/#giItT1WQy@!-/#giItT1WQy@!-/#giItT1WQy@!-/#giItT1WQy@!-/#giItT1WQy@!-/#giItT1WQy@!-/#