Uses of FDI Statistics in Macro-Economic Analysis
 undefined

D
e
l
i
v
e
r
i
n
g
m
e
t
h
o
d
o
l
o
g
i
c
a
l
c
h
a
n
g
e
t
h
r
o
u
g
h
a
n
A
g
i
l
e
a
p
p
r
o
a
c
h
Katie O’Farrell, Office for National Statistics


O
v
e
r
v
i
e
w


A
g
i
l
e
:
S
p
r
i
n
t
c
y
c
l
e

Release
burndown

Sprint
retrospective


Definition of
done


Daily Stand
Ups

Blockers


3

A
g
i
l
e
:
S
t
o
r
y
M
a
p
p
i
n
g
4
C
o
m
p
i
l
a
t
i
o
n
o
f
T
r
a
d
e
i
n
G
o
o
d
s
d
a
t
a
Input
HMRC trade
in goods data
delivered on
an overseas
trade
statistics
(OTS) basis
Output
ONS trade in goods
data produced on a
principle of
economic ownership
basis, to be included
in Balance of
Payments (BoP)
Processing
Application of
conceptual and
statistical
adjustments, in line
with ESA10/BPM6
5
C
o
m
p
i
l
a
t
i
o
n
o
f
T
r
a
d
e
i
n
G
o
o
d
s
d
a
t
a
Input
HMRC trade
in goods data
delivered on
an overseas
trade
statistics
(OTS) basis
Output
ONS trade in goods
data produced on a
principle of
economic ownership
basis, to be included
in Balance of
Payments (BoP)
Processing
Application of
conceptual and
statistical
adjustments, in line
with ESA10/BPM6
6
Merchanting
(MERCH)
Goods sent abroad for processing
(GSAPRO)
W
h
y
i
s
i
t
i
m
p
o
r
t
a
n
t
?
Part of a process of continual improvement, but also..
•
B
r
e
x
i
t
p
o
l
i
c
y
:
o
Best measure of trade and contribution to
economy is key for Brexit policy
o
Requirement to meet significant increase in
demands and new priorities from a wide range of
users
o
Reliable and robust data required for modelling
changes
7
W
h
y
i
s
i
t
i
m
p
o
r
t
a
n
t
?
•
U
K
c
o
n
t
r
i
b
u
t
i
o
n
s
t
o
t
h
e
E
U
b
u
d
g
e
t
:
o
Collection of customs tariffs and levies on behalf
of the EU
o
Percentage of harmonized VAT-base
o
Percentage of Gross National Income (GNI)
– this
forms the vast majority of UK contributions
•
Trade statistics compiled in line with
ESA10/BPM6 contribute to the calculation of GNI
•
Following a negotiated departure, the UK may
continue to make contributions to the EU budget
8
M
e
r
c
h
a
n
t
i
n
g
MERCH: “The purchase of a good by a resident (of the compiling
economy) from a non-resident combined with the subsequent resale of the
same good to another non-resident without the goods being present in the
compiling economy.” (ESA10, 18.38, p.400)
Example:
UK
merchant buys a
good from a German
resident
(recorded
as a UK negative
export),
and sells it
to a resident in Italy
(recorded as a UK
positive export),
without the good
ever entering the UK
9
G
o
o
d
s
s
e
n
t
a
b
r
o
a
d
f
o
r
p
r
o
c
e
s
s
i
n
g
GSAPRO: “Goods that change locations from one economy to another but
do not change economic ownership do not appear in imports and
exports… only the fee agreed for processing appears as a service.”
(ESA10, 18.24, p.396)
Example:
UK
resident sends a
good to Spain,
where it is
processed and then
returned to the UK
following that
processing
(service
captured within
Trade in Services
account)
10
D
a
t
a
c
o
l
l
e
c
t
i
o
n
International Trade in Services (ITIS) survey
GSAPRO
MERCH
11
I
m
p
a
c
t
o
n
T
r
a
d
e
i
n
G
o
o
d
s
s
t
a
t
i
s
t
i
c
s
•
MERCH – Positive adjustment – adds trade that is
not present in HMRC OTS dataset
•
GSAPRO – Negative adjustment – removes trade
present in HMRC OTS dataset that does not reflect a
change of economic ownership
12
Source: Table 2.4, ONS Pink Book 2017
P
r
o
p
o
s
e
d
c
h
a
n
g
e
s
•
Automation of processing and quality assurance: re-
platform on to Cloudera
•
Maximize use of new data delivery format:
o
Take on both exports and imports for MERCH
Required estimating a back series
•
Produce adjustments that better suit the new
commodity*country Trade in Goods data set:
Required creating a mapping between two different trade
classifications
Required estimating a commodity*country allocation for the
back series
13
I
m
p
a
c
t
a
n
d
i
m
p
r
o
v
e
m
e
n
t
s
•
Tighter adherence to ESA10/BPM6 guidelines
Producing better quality trade statistics in line with
international guidance
•
Removing a processing cut-off threshold; full use of
available data
•
Assign to countries and commodities in a
reproducible, reliable way
Innovative, transparent, re-usable
•
Remove processing burdens on the compilation area
Working efficiently and effectively
14
N
e
w
m
e
t
h
o
d
o
l
o
g
y
:
R
e
q
u
i
r
e
m
e
n
t
Not just OTS or BoP…
M
E
R
C
H
a
n
d
G
S
A
P
R
O
:
d
a
t
a
d
e
l
i
v
e
r
e
d
b
y
t
h
e
I
n
t
e
r
n
a
t
i
o
n
a
l
T
r
a
d
e
i
n
S
e
r
v
i
c
e
s
(
I
T
I
S
)
s
u
r
v
e
y
t
e
a
m
o
n
i
n
d
u
s
t
r
y
b
a
s
i
s
:
s
t
a
n
d
a
r
d
i
n
d
u
s
t
r
i
a
l
c
l
a
s
s
i
f
i
c
a
t
i
o
n
(
S
I
C
)
SIC: system for classifying businesses by the type of economic
industry activity they are engaged in, to level of a 4-digit code
43310 Plastering
1440 Raising of camels and camelids
15
N
e
w
m
e
t
h
o
d
o
l
o
g
y
:
R
e
q
u
i
r
e
m
e
n
t
Not just OTS or BoP…
T
r
a
d
e
p
u
b
l
i
c
a
t
i
o
n
s
:
s
y
s
t
e
m
s
c
o
m
p
i
l
a
t
i
o
n
o
n
a
c
l
a
s
s
i
f
i
c
a
t
i
o
n
o
f
p
r
o
d
u
c
t
b
y
a
c
t
i
v
i
t
y
(
C
P
A
)
b
a
s
i
s
CPA: categorize products that have common characteristics, to a 4-
digit level (Eurostat compilation).
23.52.20. Plaster
01.13.60 Vegetables seeds, except beet seeds
16
N
e
w
m
e
t
h
o
d
o
l
o
g
y
:
R
e
q
u
i
r
e
m
e
n
t
Not just OTS or BoP…
M
E
R
C
H
a
n
d
G
S
A
P
R
O
:
d
a
t
a
d
e
l
i
v
e
r
e
d
b
y
t
h
e
I
n
t
e
r
n
a
t
i
o
n
a
l
T
r
a
d
e
i
n
S
e
r
v
i
c
e
s
(
I
T
I
S
)
s
u
r
v
e
y
o
n
i
n
d
u
s
t
r
y
b
a
s
i
s
:
s
t
a
n
d
a
r
d
i
n
d
u
s
t
r
i
a
l
c
l
a
s
s
i
f
i
c
a
t
i
o
n
(
S
I
C
)
T
r
a
d
e
p
u
b
l
i
c
a
t
i
o
n
s
:
s
y
s
t
e
m
s
c
o
m
p
i
l
a
t
i
o
n
o
n
a
c
l
a
s
s
i
f
i
c
a
t
i
o
n
o
f
p
r
o
d
u
c
t
b
y
a
c
t
i
v
i
t
y
(
C
P
A
)
b
a
s
i
s
R
e
q
u
i
r
e
m
e
n
t
:
Map SIC to CPA
17
N
e
w
m
e
t
h
o
d
o
l
o
g
y
:
S
o
l
u
t
i
o
n
•
Current process: ad-hoc mapping between SIC and CPA; based
on textual descriptions
Assumes a 1-1 relationship
•
Currently no other SIC to CPA mapping in use within UK
national accounts, or in any Eurostat conversion tables.
•
Our solution: Decision on how to apportion a certain SIC into
particular CPA categories can be based on movements in trade
data
Extract a pattern of SIC-CPA from the TIG HMRC microdata
18
N
e
w
m
e
t
h
o
d
o
l
o
g
y
:
S
o
l
u
t
i
o
n
19
HMRC
microdata
•
UK exports,
imports of
goods
•
R
e
p
o
r
t
i
n
g
u
n
i
t
(
V
A
T
r
e
f
e
r
e
n
c
e
)
•
Commodity
codes (CN)
•
Period, country,
region
Inter-
Departmental
Business
Register
•
List of UK
businesses
•
Business activity
•
R
e
p
o
r
t
i
n
g
u
n
i
t
(
V
A
T
r
e
f
e
r
e
n
c
e
)
•
SIC
1
.
L
i
n
k
t
h
e
v
a
t
r
e
f
e
r
e
n
c
e
i
n
t
h
e
H
M
R
C
m
i
c
r
o
d
a
t
a
t
o
t
h
e
b
u
s
i
n
e
s
s
r
e
g
i
s
t
e
r
I
D
B
R
,
t
o
p
r
o
d
u
c
e
S
I
C
c
o
d
e
s
Linking
N
e
w
m
e
t
h
o
d
o
l
o
g
y
:
S
o
l
u
t
i
o
n
20
HMRC
microdata
•
UK exports,
imports of goods
•
SIC
•
C
o
m
m
o
d
i
t
y
c
o
d
e
s
(
C
N
)
•
P
e
r
i
o
d
,
c
o
u
n
t
r
y
,
r
e
g
i
o
n
HMRC
microdata
•
UK exports,
imports of goods
•
SIC
•
C
P
A
•
P
e
r
i
o
d
,
c
o
u
n
t
r
y
,
r
e
g
i
o
n
(
E
U
,
n
o
n
-
E
U
)
2
.
A
g
g
r
e
g
a
t
e
t
h
e
C
N
c
o
d
e
s
i
n
t
h
e
m
i
c
r
o
d
a
t
a
t
o
c
o
m
p
o
n
e
n
t
l
e
v
e
l
C
P
A
c
o
d
e
s
;
a
g
g
r
e
g
a
t
e
c
o
u
n
t
r
i
e
s
t
o
r
e
g
i
o
n
s
Aggregating
N
e
w
m
e
t
h
o
d
o
l
o
g
y
:
S
o
l
u
t
i
o
n
21
N
e
w
m
e
t
h
o
d
o
l
o
g
y
:
S
o
l
u
t
i
o
n
22
N
e
w
m
e
t
h
o
d
o
l
o
g
y
:
S
o
l
u
t
i
o
n
23
N
e
w
m
e
t
h
o
d
o
l
o
g
y
:
S
o
l
u
t
i
o
n
4. Multiply the delivered GSAPRO and MERCH values by weight at SIC
level
For d and r, get MERCH and GSAPRO adjustments by CPA
Appropriately adjust our Goods data from OTS to BoP
S
t
r
e
n
g
t
h
s
•
Automation
•
Maximises use of available data
•
Application to new trade in goods country*commodity dataset
•
Based on statistics, not textual descriptions
24
N
e
w
m
e
t
h
o
d
o
l
o
g
y
:
A
s
s
u
m
p
t
i
o
n
s
a
n
d
L
i
m
i
t
a
t
i
o
n
s
25
Assumptions
1.
Structure of products per industry sector in
merchandise/GSAPRO transactions is similar to that
in regular trade
2.
Structure of the mapper does not change from one
country to another
3.
Structure of products per industry sector changes
slowly – annual revision period
N
e
w
m
e
t
h
o
d
o
l
o
g
y
:
A
s
s
u
m
p
t
i
o
n
s
a
n
d
L
i
m
i
t
a
t
i
o
n
s
26
Assumptions
1.
Structure of products per industry sector in
merchandise/GSAPRO transactions is similar to that
in regular trade
2.
Structure of the mapper does not change from one
country to another
3.
Structure of products per industry sector changes
slowly – annual revision period
Limitations
1.
Use of services data for GSAPRO
N
e
w
m
e
t
h
o
d
o
l
o
g
y
:
N
e
x
t
s
t
e
p
s
•
In line with many other European NSI,
currently using services data for GSAPRO
Stats Netherlands best practice: longer term
engagement with other teams within ONS to bring
in appropriate sample of goods data
•
Validation of the threshold of weights:
bootstrapping Monte-Carlo experiment
27
C
o
n
c
l
u
s
i
o
n
U
s
e
f
u
l
l
i
n
k
s
a
n
d
c
o
n
t
a
c
t
s
UK Trade development plan
UK Trade monthly bulletin
UK Trade in Goods, country by commodity
dataset
UK Trade production team:
Trade@ons.gov.uk
UK Trade development project:
TradeProject@ons.gov.uk
29
Thanks to:
Ross McKenzie, George Zorinyants, Alexandra
Evans, Simon Eddolls
Questions?
30
FDI statistics play crucial roles in macro-economic data such as BOP, IIP, and external debt, aiding policy makers in decision-making processes. IIP measures external assets and liabilities with changes influenced by transactions and various factors. FDI transactions data are integrated into the BOP, classifying financial transactions and debt instruments which offer insights into a country's financial stability and reserve assets held by Central Banks.

Download Presentation

Please find below an Image/Link to download the presentation.
The content on the website is provided AS IS for your information and personal use only. It may not be sold, licensed, or shared on other websites without obtaining consent from the author.If you encounter any issues during the download, it is possible that the publisher has removed the file from their server.
You are allowed to download the files provided on this website for personal or commercial use, subject to the condition that they are used lawfully. All files are the property of their respective owners.
The content on the website is provided AS IS for your information and personal use only. It may not be sold, licensed, or shared on other websites without obtaining consent from the author.
E N D
Presentation Transcript
Delivering methodological change through an Agile approach Katie O Farrell, Office for National Statistics
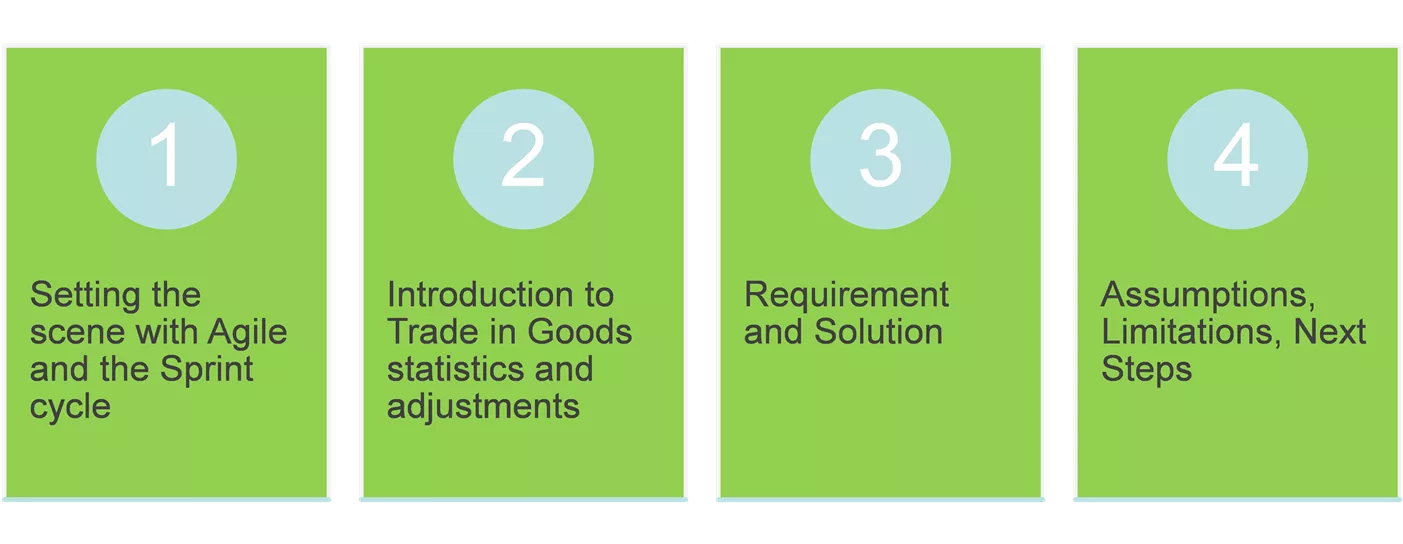
Overview 1 2 3 4 Setting the scene with Agile and the Sprint cycle Introduction to Trade in Goods statistics and adjustments Requirement and Solution Assumptions, Limitations, Next Steps
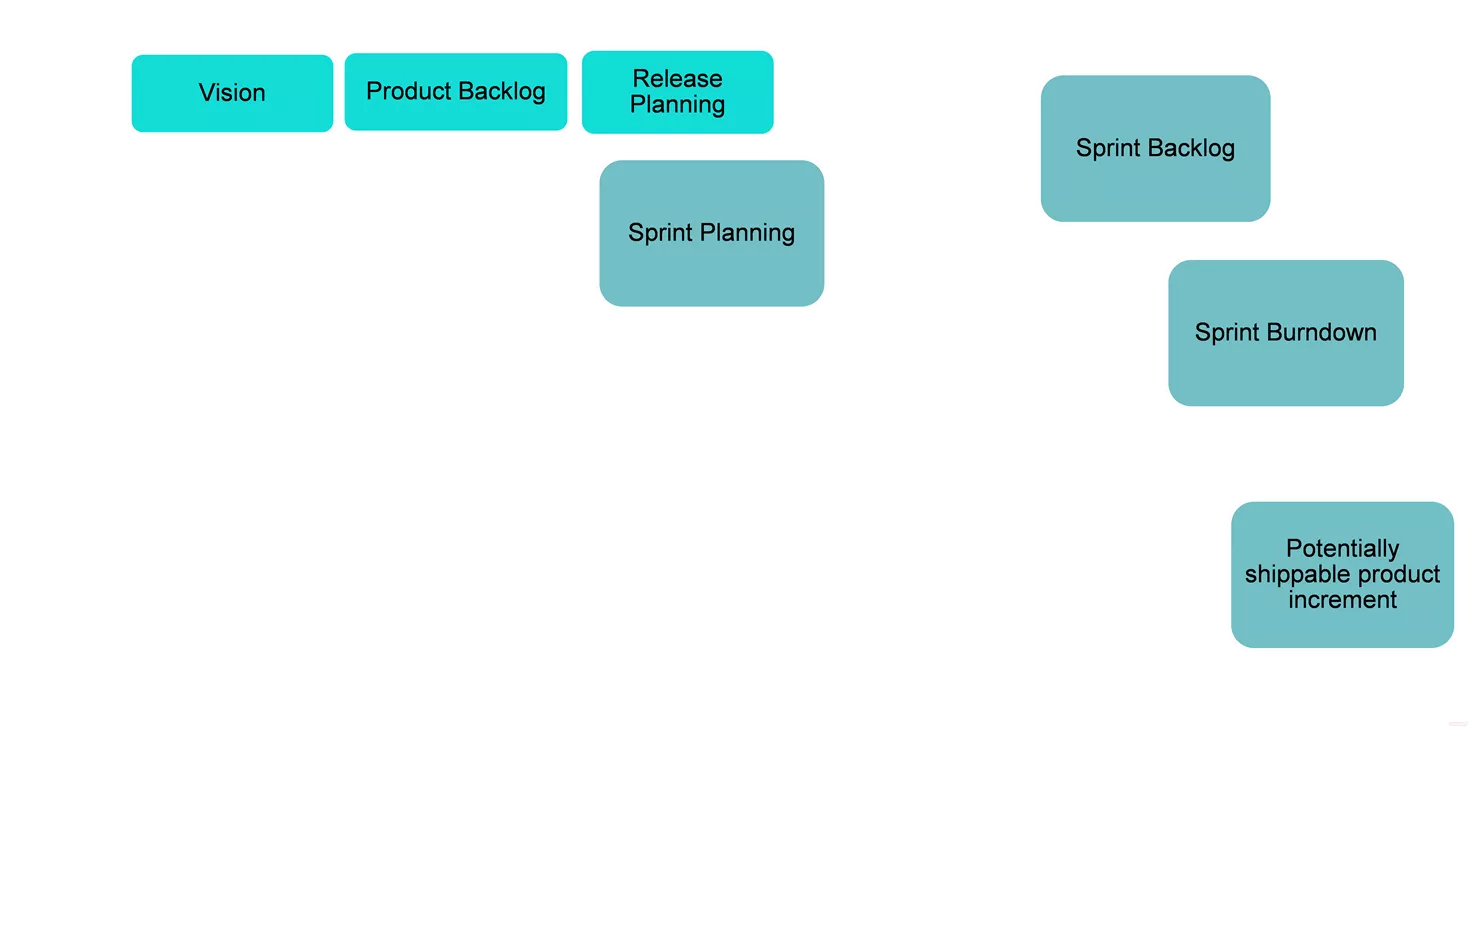
Agile: Sprint cycle Release Planning Product Backlog Vision Tasks Sprint Backlog Sprint Planning Daily Stand Ups Sprint Burndown Blockers Definition of done Potentially shippable product increment Sprint retrospective Sprint Review Release burndown 3
Compilation of Trade in Goods data Input Output Processing HMRC trade in goods data delivered on an overseas trade statistics (OTS) basis ONS trade in goods data produced on a principle of economic ownership basis, to be included in Balance of Payments (BoP) Application of conceptual and statistical adjustments, in line with ESA10/BPM6 5
Compilation of Trade in Goods data Input Output Processing HMRC trade in goods data delivered on an overseas trade statistics (OTS) basis ONS trade in goods data produced on a principle of economic ownership basis, to be included in Balance of Payments (BoP) Application of conceptual and statistical adjustments, in line with ESA10/BPM6 Merchanting (MERCH) Goods sent abroad for processing (GSAPRO) 6
Why is it important? Part of a process of continual improvement, but also.. Brexit policy: o Best measure of trade and contribution to economy is key for Brexit policy o Requirement to meet significant increase in demands and new priorities from a wide range of users o Reliable and robust data required for modelling changes 7
Why is it important? UK contributions to the EU budget: o Collection of customs tariffs and levies on behalf of the EU o Percentage of harmonized VAT-base o Percentage of Gross National Income (GNI) this forms the vast majority of UK contributions Trade statistics compiled in line with ESA10/BPM6 contribute to the calculation of GNI Following a negotiated departure, the UK may continue to make contributions to the EU budget 8
Merchanting MERCH: The purchase of a good by a resident (of the compiling economy) from a non-resident combined with the subsequent resale of the same good to another non-resident without the goods being present in the compiling economy. (ESA10, 18.38, p.400) Example: UK merchant buys a good from a German resident (recorded as a UK negative export), and sells it to a resident in Italy (recorded as a UK positive export), without the good ever entering the UK 9
Goods sent abroad for processing GSAPRO: Goods that change locations from one economy to another but do not change economic ownership do not appear in imports and exports only the fee agreed for processing appears as a service. (ESA10, 18.24, p.396) Example: UK resident sends a good to Spain, where it is processed and then returned to the UK following that processing (service captured within Trade in Services account) 10
Data collection International Trade in Services (ITIS) survey GSAPRO MERCH 11
Impact on Trade in Goods statistics MERCH Positive adjustment adds trade that is not present in HMRC OTS dataset GSAPRO Negative adjustment removes trade present in HMRC OTS dataset that does not reflect a change of economic ownership % of adjustments to Trade in Goods, 2016 Exports GSAPRO (-) MERCH (+) 19.5% ( 1784m) 27.5% ( 2520m) 6.3% ( 692m) 0% ( 0m) Imports Source: Table 2.4, ONS Pink Book 2017 12
Proposed changes Automation of processing and quality assurance: re- platform on to Cloudera Maximize use of new data delivery format: o Take on both exports and imports for MERCH Required estimating a back series Produce adjustments that better suit the new commodity*country Trade in Goods data set: Required creating a mapping between two different trade classifications Required estimating a commodity*country allocation for the back series 13
Impact and improvements Tighter adherence to ESA10/BPM6 guidelines Producing better quality trade statistics in line with international guidance Removing a processing cut-off threshold; full use of available data Assign to countries and commodities in a reproducible, reliable way Innovative, transparent, re-usable Remove processing burdens on the compilation area Working efficiently and effectively 14
New methodology: Requirement Not just OTS or BoP MERCH and GSAPRO: data delivered by the International Trade in Services (ITIS) survey team on industry basis: standard industrial classification (SIC) SIC: system for classifying businesses by the type of economic industry activity they are engaged in, to level of a 4-digit code 43310 Plastering 1440 Raising of camels and camelids 15
New methodology: Requirement Not just OTS or BoP Trade publications: systems compilation on a classification of product by activity (CPA) basis CPA: categorize products that have common characteristics, to a 4- digit level (Eurostat compilation). 23.52.20. Plaster 01.13.60 Vegetables seeds, except beet seeds 16
New methodology: Requirement Not just OTS or BoP MERCH and GSAPRO: data delivered by the International Trade in Services (ITIS) survey on industry basis: standard industrial classification (SIC) Trade publications: systems compilation on a classification of product by activity (CPA) basis Requirement: Map SIC to CPA 17
New methodology: Solution Current process: ad-hoc mapping between SIC and CPA; based on textual descriptions Assumes a 1-1 relationship Currently no other SIC to CPA mapping in use within UK national accounts, or in any Eurostat conversion tables. Our solution: Decision on how to apportion a certain SIC into particular CPA categories can be based on movements in trade data Extract a pattern of SIC-CPA from the TIG HMRC microdata 18
New methodology: Solution 1. Link the vat reference in the HMRC microdata to the business register IDBR, to produce SIC codes HMRC microdata UK exports, imports of goods Reporting unit (VAT reference) Commodity codes (CN) Period, country, region Inter- Departmental Business Register List of UK businesses Business activity Reporting unit (VAT reference) SIC Linking 19
New methodology: Solution 2. Aggregate the CN codes in the microdata to component level CPA codes; aggregate countries to regions HMRC microdata UK exports, imports of goods SIC Commodity codes (CN) Period, country, region HMRC microdata UK exports, imports of goods SIC CPA Period, country, region (EU, non- EU) Aggregating 20
New methodology: Solution We now have a dataset: ?(?,?,?,?,?,?) M is the microdata statistical value i is the industry (SIC) p is product (CPA) c is country t is period of transaction (year and month) d is direction of trade (export, import) r is region (EU, non-EU) 21
New methodology: Solution 3. Produce a set of weights For each d and r, for all countries in a region, and for periods within one year, aggregate trade value to produce matrix: ? ?,? For each i, normalise the values so that ? ? = 1, by the sum of all products in each industry: ?(?,?) ( ?(?(?,?)) ? ?,? = 0 ? ? 1; ? = 1 22
New methodology: Solution Truncated weights For a given r, d, t: SIC XXXX, 55 candidate products Majority products: ? < 1% Distribution of weight set: heavy, low-value tail Weights based on larger trade values more trustworthy than low weights Thresholding condition: x% of weights account for (1-x)% of value E.g., 10% of products account for 90% of trade in the microdata Removes long erratic tail Threshold depends on steepness of weights distribution Computed automatically for each industry 23
New methodology: Solution 4. Multiply the delivered GSAPRO and MERCH values by weight at SIC level For d and r, get MERCH and GSAPRO adjustments by CPA Appropriately adjust our Goods data from OTS to BoP Strengths Automation Maximises use of available data Application to new trade in goods country*commodity dataset Based on statistics, not textual descriptions 24
New methodology: Assumptions and Limitations Assumptions 1. Structure of products per industry sector in merchandise/GSAPRO transactions is similar to that in regular trade 2. Structure of the mapper does not change from one country to another 3. Structure of products per industry sector changes slowly annual revision period 25
New methodology: Assumptions and Limitations Assumptions 1. Structure of products per industry sector in merchandise/GSAPRO transactions is similar to that in regular trade 2. Structure of the mapper does not change from one country to another 3. Structure of products per industry sector changes slowly annual revision period Limitations 1. Use of services data for GSAPRO 26
New methodology: Next steps In line with many other European NSI, currently using services data for GSAPRO Stats Netherlands best practice: longer term engagement with other teams within ONS to bring in appropriate sample of goods data Validation of the threshold of weights: bootstrapping Monte-Carlo experiment 27
Conclusion 1 2 3 4 Agile can facilitate change and deliver impactful results Trade in Goods adjustments can be improved by maximizing use of existing datasets Still some work to be done to more accurately capture these types of trade But, marked improvement from previous process: Automated, reproducible and transparent, based on data
Useful links and contacts UK Trade development plan UK Trade monthly bulletin UK Trade in Goods, country by commodity dataset UK Trade production team: Trade@ons.gov.uk UK Trade development project: TradeProject@ons.gov.uk 29
Thanks to: Ross McKenzie, George Zorinyants, Alexandra Evans, Simon Eddolls Questions? 30