Understanding YouTube Video Trends: Dataset Analysis by Grace Dimmer
Explore the factors influencing YouTube video trends through the analysis of the dataset compiled by Grace Dimmer. The project delves into the challenges, insights, and future possibilities associated with deciphering the dynamics of trending videos on YouTube. From data overview to analysis techniques and findings, this presentation offers a comprehensive look at what makes a video popular on the platform.
Download Presentation

Please find below an Image/Link to download the presentation.
The content on the website is provided AS IS for your information and personal use only. It may not be sold, licensed, or shared on other websites without obtaining consent from the author. Download presentation by click this link. If you encounter any issues during the download, it is possible that the publisher has removed the file from their server.
E N D
Presentation Transcript
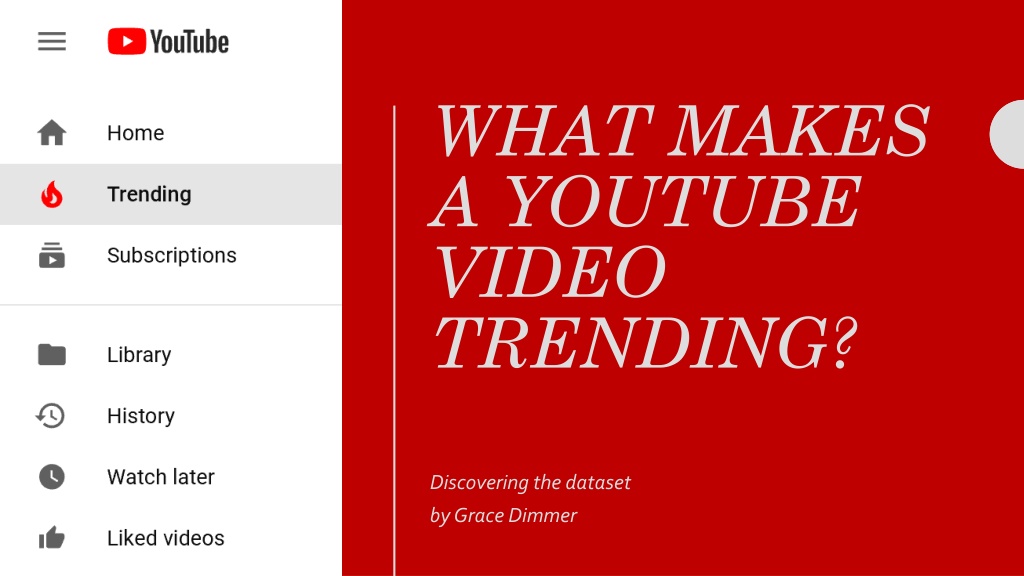
WHAT MAKES A YOUTUBE VIDEO TRENDING? Discovering the dataset by Grace Dimmer
Project Overview Why trending YouTube Videos? What factors cause YouTube videos to become trending? Can a user alter what they publish to make their video(s) more susceptible to becoming trending? This presentation contains Overview of the data Problems correlating with the data Analysis techniques Findings and conclusions from analyses Future Work
Data Overview Fields used Fields not used Title Video ID Channel Title Trending Date Category ID Publish Time The dataset Trending YouTube Video Statistics was downloaded through Kaggle, primarily generated from YouTube s Application Programming Interface (API) Tags Thumbnail Link Views Description Fields added Likes Dislikes Category Name Comment Count Raw data in CSV format Percentage Comments Disabled 40,881 records Ratings Disabled 16 fields and 2 added Video Error or Removed 514 MB
Problems Category ID given but specific categories unknown Tags, thumbnail link, video ID, and description fields are mass text data and specifically unique to each video Videos with ratings/comments enabled, yet no ratings/comments by users Some problems could not be fixed Cannot be used in pivot table effectively YouTube changes their process in deciding which videos become trending and their criteria Missing fields of interest Subscriber count Active account Video length
Analysis Used advanced filtering to find unique values for channel title and category ID Then used =countif() to count the amount of times each value occurred in the field Basic functions to find percentages, 5 number summaries and counts Mostly used advanced filtering to find specific entries Get data from web to insert corresponding categories to category ID When comment count =0 and comments disabled =FALSE Added percentage field to show how much of the ratings for each video are likes When likes/dislikes =0 and ratings disabled =FALSE When Video Error or Removed =TRUE VLOOKUP to add category field to show the specific category for each video When tags =[none] Videos with most and least likes, dislikes, comments, views, etc.
Findings Category ID Likes and Dislikes Only 5 videos with no likes when ratings were enabled, two of which had an error or were removed Most popular category is entertainment, making up 1/3 of the whole dataset Most disliked video is also most viewed video (YouTube Rewind 2017) and in the entertainment category The categories shows, non-profits & activism, and movies amount to 0%; not included in pie chart Most liked video in music category, posted by BTS. In fact, top 5 most liked videos were posted by the K-pop band Comments Travel & Events 1% Autos & Vehicles 1% Science & Technology 3% Pets & Animals 1% Education 3% 63 videos with no comments and comments enabled amounts to less than half a percent of all videos Gaming 3% How-to & Style 5% Only one video states TRUE for video error or removed that and two others do not have likes Film & Animation 5% Entertainment 33% Sports 7% Most commented video is also most liked video, posted by BTS Music 9% News & Politics 10% Comedy 9% Categories People & Blogs 10%
Views Most viewed video posted by YouTube spotlight, a channel managed by the platform itself, at 137,843,120 views Top 4 most viewed videos are the Rewind 2017 videos Least viewed video also in entertainment category and has 733 views With range of 137,842,387, data is very spread out Whether you get millions or hundreds of views, you have a chance
Ranked Top 20 Most Trending Channels Video Error or Removed SET India MSNBC 27 videos stated TRUE less than a tenth of a percent of all videos FBE The Young Turks REACT Only two have no likes and no dislikes, another has some likes but no dislikes CNN VikatanTV The Late Show with Stephen Colbert ARY Digital RadaanMedia Tags Philip DeFranco MLG Highlights 2,385 videos have no tags, making up 6% of the data Comment Awards BuzzFeedVideo Good Mythical Morning Channel Title CollegeHumor TheEllenShow No channel held a percentage out of all the videos Breakfast Club Power 105.1 FM The View Late Night with Seth Meyers Pretty evenly distributed 0 20 40 60 80 100 120 140 160 180 200
Conclusions and Future Work If you post an entertaining video, it gets views in the high hundreds at least, and gets more likes than dislikes, you are likely increasing the chances of your video becoming trending. You ll probably want some comments too Something like having a lot of subscribers may also increase your chances, but that information was not provided Investigate what YouTube should make the criteria for trending videos Add more fields and information upon further investigation Subscriber count Video length If channels are still active
