Understanding Usage Metrics in Library Collections

Exploring the importance of usage metrics like COUNTER and SUSHI in libraries, covering topics such as e-books, e-journals, databases, and more. Learn about obtaining, compiling, and storing this data to enhance collection access and acquisitions.

Uploaded on Sep 16, 2024 | 0 Views
Download Presentation

Please find below an Image/Link to download the presentation.
The content on the website is provided AS IS for your information and personal use only. It may not be sold, licensed, or shared on other websites without obtaining consent from the author. Download presentation by click this link. If you encounter any issues during the download, it is possible that the publisher has removed the file from their server.
E N D
Presentation Transcript
Rock, paper, scissors, COUNTER, SUSHI: Making sense of usage Jennifer Bazeley Head, Collection Access & Acquisitions Miami University Libraries ALAO CMIG Workshop June 9, 2014
The truth of the matter https://twitter.com/FakeLibStats/status/464074593049649153
The approach Select Obtain Compile Store Analyze - Visualize Disseminate Share
Select - Understand the standards SUSHI & COUNTER https://www.flickr.com/photos/crobj/14269377082/
Select Which usage is important? E-books, e-journals, databases (COUNTER & non-COUNTER reports) PDA Link resolver & A to Z Discovery service Book and journal circulation numbers (checkouts, internal use, renewals)
Caveats: theres always a but Vendor/publisher discrepancies Technology fails Garbage in, garbage out
Obtain Electronic Publisher, platform, vendor, consortia websites Self-service, automated e-mails, gentle prodding of vendor Print Your friendly ILS Review files, statistics, web management reports
Compile Excel Usage statistics software
Store Someplace in addition to your hard drive Library or departmental server Dropbox Google Drive Usage statistics software
Analyze Combine/compare usage with other data Benchmark against peer/aspirational institutions Apply existing principles (e.g., Pareto) Patterns over time, across platforms, across locations Predict/extrapolate
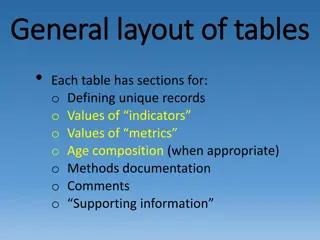
Visualize Charts & graphs Pivot tables Word clouds Infographics
Disseminate - Share Google Drive LibGuides EBSCOnet
Useful Resources Bucknell, Terry. Garbage in, gospel out: twelve reasons why librarians should not accept cost per download figures at face value. The Serials Librarian, 63 no. 2 (2012): 192-212. Tufte, Edward R. Envisioning Information. Cheshire, Conn.: Graphics Press, 1990. COUNTER v. 4 http://www.projectcounter.org/r4/COPR4.pdf http://www.projectcounter.org/r4/APPF.xls SUSHI http://www.niso.org/workrooms/sushi/librarians/
Questions? bazelejw@miamioh.edu https://www.flickr.com/photos/crobj/5558548657