Understanding Rational Functions and Graphs
Learn about rational functions, including how to define, simplify, and graph them. Explore the parts of graphs such as x-intercepts, y-intercepts, vertical asymptotes, horizontal asymptotes, angled asymptotes, and holes. Discover steps to find all information about rational functions, including horizontal asymptotes, y-intercepts, factors, x-intercepts, vertical asymptotes, domain, and range.
Download Presentation

Please find below an Image/Link to download the presentation.
The content on the website is provided AS IS for your information and personal use only. It may not be sold, licensed, or shared on other websites without obtaining consent from the author. Download presentation by click this link. If you encounter any issues during the download, it is possible that the publisher has removed the file from their server.
E N D
Presentation Transcript
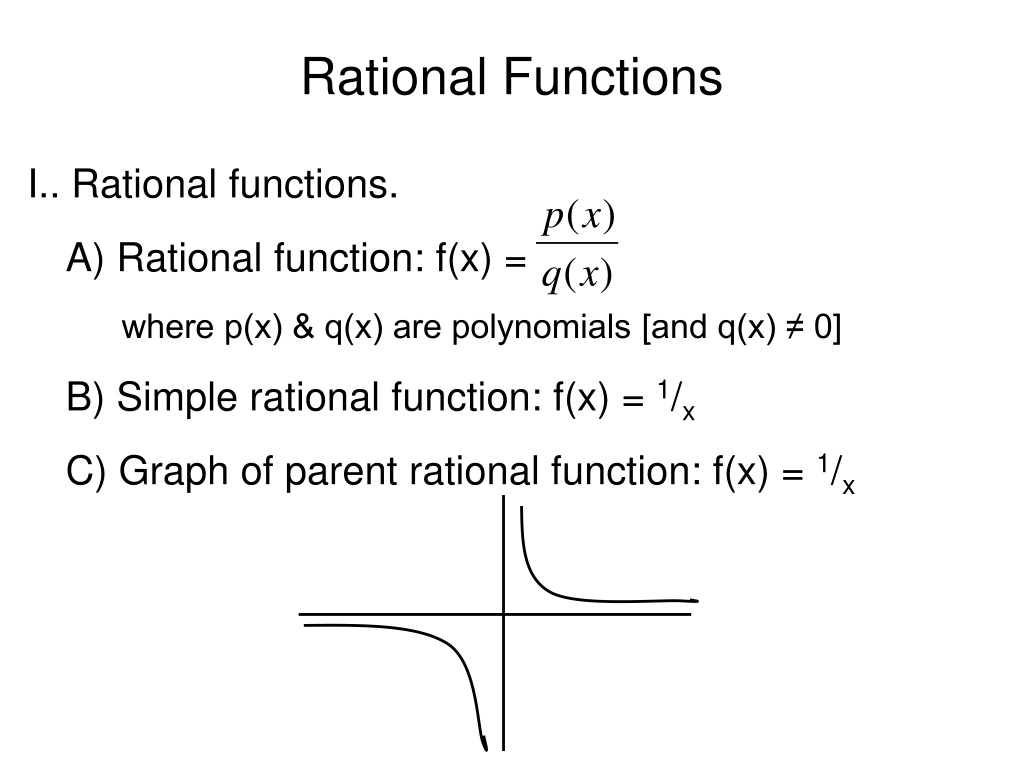
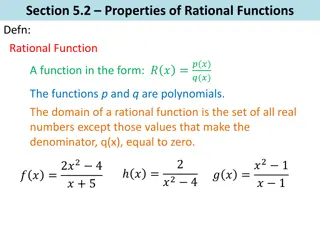
Rational Functions I.. Rational functions. ( ) p x A) Rational function: f(x) = ( ) q x where p(x) & q(x) are polynomials [and q(x) 0] B) Simple rational function: f(x) = 1/x C) Graph of parent rational function: f(x) = 1/x
Rational Functions ( ) p x = ( ) f x II.. Parts of graphs of rational functions: A) x-intercepts (the solutions, roots, etc.) 1) Factor the TOP polynomial (if needed). 2) Set each factor = 0 and solve. 3) The solutions are the x-intercepts. Put dots on graph. B) y-intercept (0, #) 1) Change all the x s to zero. Solve for y. Plot the point. C) Vertical asymptote lines (lines the graph doesn t touch). 1) Factor the BOTTOM polynomial (if needed). 2) Set each factor = 0 and solve. 3) The solutions are the equations of the vertical asymptote lines. Draw vertical dotted lines at x = #. ( ) q x
Rational Functions ( ) p x = ( ) f x II.. Parts of graphs of rational functions: ( ) q x D) Horizontal asymptote lines (cheerleader test). 1) Look at the degree of the top & bottom polynomial. Ask yourself, Could cheerleaders make this pyramid? a) If YES (more on bottom than on top), then horizontal asymptote is y = 0. b) If NO (more on top than on bottom), then there is NO horizontal asymptote. c) If TOP = BOTTOM (special case), then the horizontal asy is y = a/b(leading coeff).
Rational Functions ( ) p x = II.. Parts of graphs of rational functions: E) Angled asymptote lines. 1) If the TOP degree is exactly 1 bigger than the BOTTOM degree, then you have an angled asymptote. a) The angled line has an equation of y = mx + b, 1) To get the equation use long division on f(x) (or synthetic division if the bottom is x1 k). 2) The answer is y = mx + b (ignore remainder). Draw the dotted angled asymptote. F) Holes in the graph (neither a zero nor a vertical asymptote). 1) If you have a common factor in the top and the bottom that cancel out, you will have a hole at its (x,y) solution. ( ) f x ( ) q x
Rational Functions III.. Steps for finding all info on rational functions: A) Use the Cheerleader test to find the horizontal asymptote. 1) Gives a dotted horizontal asymptote line at y = #. B) Find the y-intercept by changing the x s to 0 s and solve. 1) Gives a point on the y-axis (0 , #). C) Factor the TOP and factor the BOTTOM of the function. 1) Cancel out like factors. These cancelled factors will be holes in the graph. Set cancelled factor = 0 and solve. This is the x coordinate of a hole in the graph. 2) x-intercepts (solutions, zeroes, roots) are found by solving the TOP factors. Gives pts on x-axis (# , 0). 3) Vertical asymptotes are found by solving the BOTTOM factors. Gives dotted vertical asymptote line(s) at x = #. D) Domain & Range is all real #s except the asymptote lines & x holes. Domain = {r: x #, x } and Range = {r: y #}
Rational Functions ( ) p x = ( ) f x IV.. Graphing rational functions: ( ) q x A) Factor the TOP & BOTTOM parts. (Cancel down = holes) B) Use the factors to find x-intercepts & vertical asymptotes. C) Use the Cheerleader test to find the horizontal asymptote. D) Plot points on each side of the vertical asy. (y =, table) 1) Choose pts very close to each vertical asy. 2) Choose a point in the middle (between vert asy) 3) Choose a large & + pt for begin / end behavior. E) Connect the points with smooth curved lines. 1) Note: The graph might cross the horizontal asy near the vert asymptotes, but the beginning / end will never cross the horizontal asy (or angled asy).
