Understanding Monopoly and Monopsony in Economics
Explore the concepts of monopoly and monopsony in economics, where a single seller or buyer influences market prices. Learn about monopolist profit maximization, pricing strategies, and the impact on market welfare.

Download Presentation

Please find below an Image/Link to download the presentation.
The content on the website is provided AS IS for your information and personal use only. It may not be sold, licensed, or shared on other websites without obtaining consent from the author. If you encounter any issues during the download, it is possible that the publisher has removed the file from their server.
You are allowed to download the files provided on this website for personal or commercial use, subject to the condition that they are used lawfully. All files are the property of their respective owners.
The content on the website is provided AS IS for your information and personal use only. It may not be sold, licensed, or shared on other websites without obtaining consent from the author.
E N D
Presentation Transcript
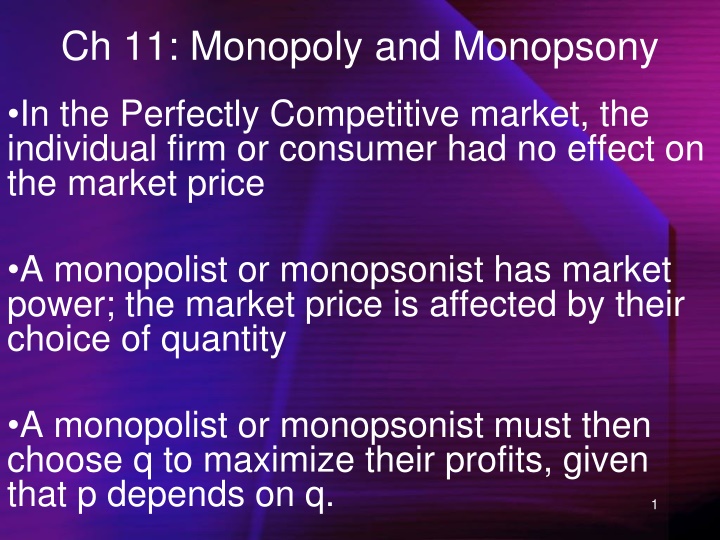
Ch 11: Monopoly and Monopsony In the Perfectly Competitive market, the individual firm or consumer had no effect on the market price A monopolist or monopsonist has market power; the market price is affected by their choice of quantity A monopolist or monopsonist must then choose q to maximize their profits, given that p depends on q. 1
Chapter 11: Monopoly & Monopsony In this chapter we will cover: 11.1 Monopoly Features 11.2 Monopolistic Profit 11.3 Monopoly Supply 11.4 Inverse Elasticity Pricing Rule 11.5 Welfare Effect of Monopolies 11.6 Why Monopolies? 11.7 Monopsonists 2
11.1 Monopoly Features A MONOPLY is an industry where there is only ONE producer/seller. The monopolist is the market; they face the market demand curve P(Q). By lowering price, the monopolist is able to sell more goods. 3
11.2 Monopolist Profit A monopolist faces the market demand curve: P=f(Q) ie: P=a-bQ A monopolist s revenue is equal to: TR=PQ ie: TR=aQ-bQ2 A monopolist s costs increase with production: TC=f(Q) ie: TC=Q2 4
Monopolist Profit A monopolist s profit is the difference between total revenue and total cost: Profit=TR-TC Ie: Profit=aQ-bQ2-Q2 The monopolist's profit maximization problem: Max (Q) = TR(Q) - TC(Q) Q 5
Monopolist Profit If MR > MC, the monopolist is increasing profit and should produce more If MR< MC, the monopolist is decreasing profit and should produce less Therefore (like PC), the monopolist maximizes profits when MR=MC. 6
TC TR Profit Q P MR=MC MC D MR Q 7
Example Demand: P=20-2Q MR=20-4Q MC=5+Q MR=MC 5+Q=20-4Q 5Q=15 Q=3 P=20-2q P=14 8
Marginal Revenue When a monopolist increases production, 2 things occur: 1)The monopolist earns MORE revenue from the extra goods sold 2)The monopolist earns LESS revenue from the previous goods sold due to a reduced price: TR MR = + P Q Q P = Q Q P = + MR P Q Q 9
Revenue Change: Q increases to Q2 P Revenue Lost on units Therefore marginal revenue is less than price. P1 P2 Revenue gained on new units Demand Q Q1 Q2 10
Example: A monopolist facing demand curve P=28-2Q originally produces 10 units. Calculate the revenue gained and lost by moving to 11 units. P(10)=28-2(10) P(10)=8 P(11)=6 Revenue gained = P(11) = 6 Revenue lost =[P(10)-P(11)]10 Revenue lost = (8-6)(10)=20 11
Marginal Revenue and Linear Demand When demand is linear, MR has a slope twice as steep. P Demand: P=100-4Q Q MR=100-8Q 12
Average Revenue For the monopolist, AR(Q)=TR(Q)/Q AR(Q)=P(Q) Or, since price is found on the demand curve, AR(Q)=D Since MR is always below the demand curve, AR(Q)>MR(Q) If Q>0 13
Monopolist Profit Maximization 1)The Monopolist will produce Q where MR=MC 2)Given this Q, the monopolist will charge a price determined by their demand curve 3)Monopolist profit is equal to: TR-TC Or PxQ-ACxQ Or (P-AC)Q 14
Price MC AC 100 e 80 Profit MR 20 Demand curve 20 50 Quantity 15
11.3 Monopolist Supply The Monopolist does not have a suply curve! Why? For the Perfect Competitor, price is exogenous; taken as given. For the Monopolist, price is endogenous; it is part of the Monopolist s decision. 16
Monopolist Supply Here the monopolist offers 20 units at 2 different prices, dependent on demand Therefore, no supply curve exists Price 80 MC 20 MR1 D1 17 20 MR2 D2 Quantity
MR and Elasticity of Demand We can rewrite the MR curve as follows: MR = P + Q P/ Q = P(1 + (Q/P)( P/ Q)) = P(1 + 1/ ) where: is the price elasticity of demand, (P/Q)( Q/ P) 18
MR and Elasticity of Demand Using this formula: When demand is elastic ( < -1), MR > 0 When demand is inelastic ( > -1), MR < 0 When demand is unit elastic ( = -1), MR= 0 Therefore, The monopolist will always operate on the elastic region of the market demand curve 19
Price Example: Elastic Region of the Demand Curve a Elastic region ( < -1), MR > 0 Unit elastic ( =-1), MR=0 Inelastic region (0> >-1), MR<0 a/2b a/b Quantity 20
11.4 Inverse Elasticity Pricing Rule Since at equilibrium, MC=MR: IEPR: The monopolist s markup above MC (as a percentage of price) is the negative inverse of elasticity of demand 1 = + * ( 1 ) MC P * P = * P MC 1 * P MC = * P 21
Example: = -2 MC = $50 a. What is the monopolist's optimal price? MR = MC P(1+1/ ) = MC P(1+1/(-2)) = 50 P* = 100 22
Inverse Elasticity Pricing Rule Since at equilibrium, MC=MR: IEPR: The monopolist s markup above MC (as a percentage of price) is the negative inverse of elasticity of demand 1 = + * ( 1 ) MC P * P = * P MC 1 Note: The IEPR is related to the Lerner Index of Market Power . * P MC = * P 23
The Lerner Index of Market Power While a firm may be a monopoly, its MARKET POWER, or control over price may be limited. -Perhaps people don t really need the good -Perhaps imperfect substitutes exist The Lerner index of market power measures market power; the control a firm has over price 24
The Lerner Index of Market Power Lerner Index = (P-MC)/P = -1/ The Lerner Index lies between 0 and 1 The Lerner Index is 0 for a perfectly competitive firm (P=MC, the firm has no control over price). 25
Shifts in market demand A shift in market demand will cause the monopolist s MR curve to shift also This will cause a new equilibrium (MR=MC) This new equilibrium will cause a new price 26
Price MC Here an increase in demand increased monopoly price and quantity P1 P0 D1 MR1 D0 Q0 Q1 Quantity 27 MR0
Example An ice cream monopolist with a MC curve of MC=Q originally faced a demand curve of P=20-2Q. Due to an increase in temperature, demand shifted to P=35-2Q. Calculate the change in price and quantity due to this shift in demand. 28
Example: ORIGINALLY: P=20-2Q MR=20-4Q MR=MC 20-4Q=Q 4=Q P=20-2Q P=20-2(4) P=12 29
Example: AFTER DEMAND SHIFT: P=35-2Q MR=35-4Q MR=MC 35-4Q=Q 7=Q P=35-2Q P=35-2(7) P=21 30
Example The shift in demand caused: -An increase in monopoly price of $9 ($21-$12) -An increase in quantity produced of 3 cones (7-4) 31
Shifts in marginal cost A shift in marginal cost will create a new equilibrium (MR=MC) This new equilibrium will cause a new price Increases in cost will always raise price and decrease quantity supplied for a monopolist 32
Price MC1 MC An increase in cost increases monopoly price and decreases quantity supplied P1 P0 D0 Q1 Q0 Quantity 33 MR0
11.5 Welfare Effects of Monopolies We saw before how a perfectly competitive market maximized consumer and producer surplus Since a monopoly decreases output to increase prices, a monopoly will normally create a DEADWEIGHT LOSS: 34
CS with competition: A+B+C PS with competition: D+E MC=S A PM B C PC E D Demand QM QC 35 MR
CS with monopoly: A PS with monopoly:B+D MC=S A PM B DWL = C+E C PC E D Demand QM QC 36 MR
Rent Seeking Since PM>AC for most Monopolists, they earn ECONOMIC PROFIT. There is an incentive for a monopoly to maintain market power. RENT SEEKING is any activity aimed an creating or preserving monopoly power: Government lobbying/bribes Advertising Hiring Thugs This rent seeking behaviour is a social cost beyond simple deadweight losses 37
Maximum rent seeking cost=B+D MC=S DWL = C+E A PM B C PC E D Demand QM QC 38 MR
11.6 Why Monopolies? Monopolies exist for a number of reasons, some good , some bad : Natural Monopolies Barriers to Entry Structural Legal Strategic 39
Natural Monopolies A natural monopoly exists in an industry with INCREASING RETURNS TO SCALE: One large firm is a natural monopoly if it can supply the total market at a lower total cost than any other 2 firms: 40
Example: Natural Monopoly Price If total market quantity is 45,000, one firm has a natural monopoly AC Demand 45,000 22,500 41 Quantity
Example: Natural Monopoly Price If total market quantity increased to 80,000, the natural monopoly might not last AC Demand Q 40,000 80,000 42
Barriers to Entry Normally, if economic profit is available in an industry, firms will enter until that profit is pushed to zero. A BARRIER TO ENTRY is any factor that allows a firm to earn positive economic profit while making it unprofitable for another firm to enter 43
Barrier to Entry Structural A structural barrier to entry is a cost or demand advantage that prevents another firm from entering -Cost Advantages (includes natural monop.) -Positive Externalities (iTunes/Ebay) -Advertising/Brand Dominance (Kleenex, Heinz) -May be seen as strategic barrier 44
Barrier to Entry Legal A legal barrier to entry exists when a firm is legally protected from competition. -Patents (encourages research) -Exclusive Rights -ie: Marijuana growers -ie: Out-of-country vehicle inspections (ie: Canadian Tire) -ie: Printing Money (Canadian Mint) -ie: Degrees (Universities) Often these barriers are set up for good reasons 45
Barriers to Entry Strategic A strategic barrier to entry exists when a firm takes EXPLICT steps to prevent entry -Operating at a loss/reduced profit -Developing a Predatory Reputation - Unofficial agreements to maintain monopoly -Consumer Contracts -Incompatible inputs (ie: Phone numbers, memory cards, software, chargers, etc.) 46
Lowering profits to avoid competition If PX was still profitable to the monopolist, it could keep other firms out of the market. MC=S PM PC PC Losses PX Demand QM QC 47 MR
11.7 Monopsonist A MONOPSONIST is a single buyer of a good or input. -ie: Only the government purchases military equipment (we hope). -If the film Teenage Mutant Ninja Star Spidermen 4: The Ballet of the Forgotten Princess were to film in Edmonton, there d be 1 film but many people wanting to be extras -The monopsonist faces the market supply curve 48
Marginal Revenue Product of Labor Marginal Product (MP) is the additional productivity of another unit of input. -ie: 1 more worker increases output by 7 Marginal Revenue Product (MRP) is the additional revenue of another unit of input. -ie: 1 more worker increases revenue by $21 (if each output sells for $3) MRP=P x MP 49
Marginal Expenditure on Labour Since the monopsonist faces the market supply curve, it can only increase inputs (ie: Labour) by increasing the price To hire another worker, the monopsonist both has to give that worker a higher wage, plus increase the wage of every other worker: w = + MEL w L L 50