Thermogravimetric Analysis (TGA) in Pharmaceutical Applications


Thermogravimetric Analysis (TGA)

•
PRINCIPLE
•
INSTRUMENTATION
•
FACTORS AFFECTING RESULTS
•
ADVANTAGES AND DISADVANTAGES
•
PHARMACEUTICAL APPLICATIONS


Principle

•
TGA measures the amount and the rate of
weight
change of a material with respect to temperature or
time in controlled environments.
•
The mass of a sample in a controlled atmosphere is
recorded continuously as a function of temperature
(or time) as the temperature of the sample is
increased.
•
TGA
thermogram:
-A plot of mass percent as a function of time or
temperature.
TGA measures the change in weight of a sample
as it is heated, cooled or held at constant
(isothermal) temperature
.
PRINCIPLE
A large number of chemical substances invariably decompose
upon heating, and this
heating a sample & observing weight
change
is the principle of thermogravimetric analysis (TGA).
TGA may be sub-divided into two heads, namely :
(a) Static (or Isothermal) Thermogravimetric Analysis, and
(b) Dynamic Thermogravimetric Analysis.
Static (Isothermal) Thermogravimetric Analysis
The sample under analysis is maintained at a
constant
temperature
for a period of time during which any changes in
weight are observed carefully.
Dynamic Thermogravimetric Analysis
Sample is subjected to conditions of predetermined, carefully
controlled
continuous increase in temperature
that is invariably
found to be linear with time.
Thermogram: TG curve of a single stage
Two Temperatures:
Ti: initial lowest temperature
at which the onset of a mass
change is detected,
procedural
decomposition temperature
Tf: Final T decomposition
appear to be complete
Ti-Tf
difference
: reaction
interval
INSTRUMENT
Instrument:
is“Thermobalance” Data recorded in form of curve
known as ‘Thermogram’.
A TGA consists of three major parts
(1) A sensitive analytical balance :
Range : up to 100 mg.
Sample holder is in furnace. However, the rest of the balance
must be thermally isolated from the furnace.
(2) furnace: Heating Device
Temperature range: up to 1500°C.
(3) Unit for temperature measurement & control
(4)
Recorder:
automatic recording unit for the mass and
temperature changes
purge gas system :
For prevention of oxidation: N
2
Ar, He, etc.
For oxidation: O
2
or air.
BLOCK DIAGRAM OF THERMOBALANCE
Thermobalance components. The balance beam is shown as A. The sample cup and holder are
B; C is a counterweight. D is a lamp and photodiodes, E is a magnetic coil, and F is a permanent
magnet. The computer data-acquisition, data-processing, and control systems are
components G, H, and I. Component J is the printer and display unit.
Oven/heater for heating,
ceramic rod/pan, and
balance.
•
The TGA instrument
continuously weighs a
sample as it is heated
to temperatures of up
to 2000
°
C for coupling
with FTIR and Mass
spectrometry gas
analysis.
Balances
•
Basic :
accuracy, sensitivity, reproducibility, and capacity
•
Two types :
(a)
Null-point Type :
•
incorporates a
sensing element
which detects a deviation of the balance
beam from its null position
•
A sensor detects the deviation and triggers the restoring force to bring the
balance beam to back to the null position. The restoring force is directly
proportional to the mass change.
•
(b)
Deflection Type :
•
conversion of the balance beam deflection about the fulcrum into a suitable
mass change trace by
•
(a) photographic recording i.e change in path of a reflected beam of light
available of photographic recording,
•
(b) recording electrical signals generated by an appropriate displacement
measurement transducer, and
•
(c) using an electro-chemical device. The different balances used in TG
instruments are having measuring range from 0.0001 mg to 1 g depending
on sample containers used.
FURNACE
•
The furnace and control system must be designed to
produce linear heating at over the whole working
temperature range of the furnace and provision must be
made to maintain any fixed temperature. A wide
temperature range generally 150-2000°C of furnaces is used
in different instruments. The range of furnace basically
depends on the types of heating elements are used.
•
The temperature control of the furnace is satisfactorily achieved
via a thermocouple mounted very close to the furnace-winding.
The maximum operational temperature may be obtained by
using different thermocouples as indicated below :
•
Temperature measurement are commonly done
using thermocouples , chromal – alumel
thermocouple are often used for temperature up
to 1100 °C whereas Pt/(Pt–10% Rh) is employed for
temperature up to 1750 °C.
•
Temperature may be controlled or varied using a
program controller with two thermocouple
arrangement, the signal from one actuates the
control system whilst the second thermocouple is
used to record the temperature.
Temperature Measurement and Control
Recorder
The recording device must be such so as to :
(
i) record both temperature and weight continuously, and
(
ii) make a definite periodic record of the time.
•
Graphic recorders are preferred to meter type recorders.
•
X-Y recorders are commonly used as they plot weight directly against
temperature.
•
Facilitate microprocessor controlled operation and digital data
acquisition and processing using personal computer with different
types recorder and plotter for better presentation of data.
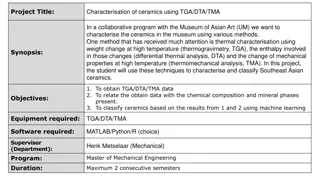
In this diagram, whole of the
balance system is housed in a
glass to protect it from dust and
provide inert atmosphere.
There is a control mechanism to
regulate the flow of inert gas to
provide inert atmosphere and
water to cool the furnace.
The temperature sensor of
furnace is linked to the
programme to control heating
rates, etc.
The balance output and
thermocouple signal may be fed
to recorder to record the TG
Curve.
schematic diagram of the specific balance and furnace
assembly as a whole to better understand the working of a thermobalance.
Thermogravimatic Curves
•
Quantitative aspects of TG
•
TG curves represent the variation in the mass (
m) of the sample with
the temperature (T) or time (t).
Sometime we also record
derivative thermogravimetric
(DTG) Curves.
A DTG curve presents the rate
of mass change (d
m/dt) as a
function of temperature, or time
(t)
against
T on the abscissa (x
axis) as shown in Fig. when
substance is heated at
uniform
rate. In this figure, the
derivatives of the Curve is
shown by dotted lines.
METHODOLOGY
•
The ‘
thermogram’ for calcium oxalate monohydrate
(CaC
2
O
4
.H
2
O). The successive plateaus correspond to
the anhydrous oxalate (100-250°C), calcium carbonate
(400-500°C), and finally calcium oxide (700-850°C). In
other words, these plateaus on the decomposition curve
designate
two
vital aspects, namely :
(
a) clear indication of constant weight, and
(
b) stable phases within a specified temperature
interval. The chemical reactions involved may be
summarized as follows :
Interpretation of Thermogram
the thermogravimetric evaluation of CaC
2
O
4
.H
2
O, it is ensured
that the weight of this product decreases in several stages,
namely :
•
Stage 1 : The water of hydration (or crystallization) from calcium
oxalate monohydrate is lost which
•
corresponds to 2.46 mg (12.3%) equivalent to 1 mole of H
2
O in the
temperature range 100-250°C.
•
Actually, the 12.3% weight loss that took place between 100-250°C
should correspond to 12.3% of the original formula weight for
CaCO
3
H
2
O (FW = 146). Hence, the product being lost has a formula
weight of 0.123 × 146 = 17.958 (~_ 18.0), and it corresponds to H
2
O.
•
Stage 2 : One mole of carbon monoxide is evolved subsequently
from calcium oxalate, corresponding
2 to 3.84 mg (19.2%) in the
temperature range 400-500°C.
•
The 19.2% weight loss that occurred between 400-500°C should
correspond to 19.2% of the original formula weight of 146. Therefore,
the product being given out has a formula weight of 0.192 × 146 = 28.0,
that corresponds to CO.
•
Stage 3 : Finally, a mole of CO
2
is evolved from calcium carbonate
that corresponds to 6.02 mg (3.01%) in the temperature range 700-
850°C.
FACTORS AFFECTING TG CURVE
•
These factors may be due to
instrumentation or nature of
sample:
1.
Instrumental factors:
i) Furnace heating rate.
ii) Recording or chart speed
iii) Furnace atmosphere
iv) Geometry of Sample holder/
location of sensors
v) Sensitivity of recording
mechanism.
vi) Composition of sample container.
2
. Sample Characteristics:
a) Amount of sample
b) Solubility of evolved gases in
sample.
c) Particle size
d) Heat of reaction
e) Sample packing
f) Nature of sample
g) Thermal conductivity.
Furnace heating rate
•
At a given temperature, the degree of decomposition is greater at the slower
heating rate, and thus it follows that the shape of the TG curve can be
influenced by the heating rate.
•
For a single stage endothermic reaction it has been found that
•
F and S indicate fast and slow heating rate
•
polystyrene decomposes 10% by mass when heating rate is 1°C per min by
357 °C and 10% by mass when heating rate is 5 °C per min by 394 °C.
•
Ti & Tf will decrease
with decrease in heating rate and the TG curve
will be shifted to the left.
•
The appearance of an inflection in a TG curve at a fast heating rate
may well be resolved into a plateau at a slower heating rate.
Therefore, in TGA there is neither
optimum no standard
heating
rate, but a heating rate of 3 °C per min. gives a TG curve
with
maximum
meaningful resolution.
Recording or chart speed
•
The chart speed on the recording of the TG curve of
rapid or slow reaction effects greatly on the shape
of the TG curves.
•
For a slow decomposition reaction: Low chart
speed for recording the TG curve because at high
chart speed the curve will be flattened and it will
not show the sharp decomposition temperature.
•
For a slow reaction followed by a rapid one: at the
lower chart speed the curve will show less
separation in the two steps than the higher chart
speed curve.
•
For fast-fast reaction followed by slower one similar
observation are observed in shorter curve plateaus.
Furnace Atmosphere
The effect of atmosphere on the TG curve
depends on
(i) The types of the reaction
(ii) The nature of the decomposition products
(iii) Type of the atmosphere employed.
The effect of the atmosphere on TG curve
may be illustrated by taking the example
of thermo-decomposition of a sample of
monohydrates of calcium oxalate in dry
O
2
and dry N
2
as shown in fig.
•
The small difference is due to difference
in the nature/composition of CaCO
3
formed in the two atmospheres.
•
This is due to the particle size, surface
area, lattice defects or
due to the other
physical characteristics of
CaCO
3
formed
Sample Holder
•
Range from flat plates to deep crucible of various capacities.
•
The shape of the TG curve vary as the sample will not be heated in
identical condition.
•
Generally, it is preconditioning that the thermocouple is placed on
near the sample as possible and is not dipped into the sample
because it might be spoiled due to sticking of the sample to the
thermocouple on heating.
•
So actual sample temperature is not recorded, it is the temperature
at some point in the furnace near the sample. Thus it leads to
source of error due to the thermal lag and partly due to the finite
time taken to cause detectable mass change.
•
If the sensitivity of recording mechanism is not enough to record
the mass change of the sample then this will also cause error in
recording the weight change of the sample.
•
If the composition of the sample is such that it reacts either with
the sample, or product formed or the evolved gases then this will
cause error in recording the mass change of the sample.
Effect of Sample Mass
•
The sample mass affects the TG curve in following
•
i) The endothermic and exothermic reactions of the
sample will cause sample temperature to deviate
from a linear temperature change.
•
ii) The degree of diffusion of evolved gases through
the void space around the solid particles.
•
iii) The existence of large thermal gradients
throughout the sample particularly, if it has a low
thermal conductivity.
•
Thus, it is preferable to use as small a sample as
possible depending on the sensitivity of the balance.
Effect of Sample Particle Size
•
The particle size will cause a change in the diffusion
of the evolved gases which will alter the reaction
rate and hence the curve shape.
•
The smaller the particle size, greater the extent of
decomposition at any given temperature.
•
The use of large crystal may result in apparent
vary rapid mass loss during heating.
•
This may be due to the mechanical loss of part of
the sample by forcible ejection from the sample
container, when the accumulated evolved gases
within the coarse grains are suddenly released.
Effect of Heat of Reaction
•
The heat of reaction will affect the extent to which sample
temperature proceeds or succeeds the furnace temperature.
This depends on whether the reaction is exothermic or
endothermic and consequently the extent of decomposition
will also be affected.
•
The other sample characteristics such as sample packing,
nature of the sample and its thermal conductivity will also
affect the shape of TG curves. If the sample is packed loosely
then the evolved gases may diffuse more easily than if the
sample packed tightly.
•
If the sample reacts with the sample container on heating
then it will not give the mass of the product formed so the
sample will change. We can avoid this effect by a sensible
choice of sample container.
ADVANTAGES DISADVANTAGES
•
Any type of solid can be analyzed
With minimal sample preparation
(at least 0.1mg) eg : powders,
pellets, flakes
• TGA has high accuracy of balance
used as well as precise control of
heating/cooling rate and
atmospheric condition
• TGA may be convenient and time
saving, performance of technique
does suffer due to construction
requirements
• Easy sample changing and easy
change of sample holder
• Fast heating rate with good
resolution can be maintained
• In TGA one can hold the furnace at
1000°C without any balance drift,
which is not balanced in other
thermobalance
• Solid sample only must be used in
quantitative and qualitative analysis
• Data interpretation is not always
straight forward
• Very small Amount of samples are
used but non-homogeneous material
cannot be tested
• Sensitive to heating rate and sample
masses results in shift in temperature
• Limited to sample which undergoes
weight change.
APPLICATIONS
•
Purity and thermal stability.
•
Solid state reactions.
•
Decomposition of inorganic and organic compounds.
•
Determining composition of the mixture.
•
Corrosion of metals in various atmosphere.
•
Pyrolysis of coal, petroleum and wood.
•
Roasting and calcinations of minerals.
•
Reaction kinetics studies.
•
Evaluation of gravimetric precipitates.
•
Oxidative and reductive stability.
•
Determining moisture, volatile and ash contents.
•
Desolvation, sublimation, vaporizations, sorption, desorption,
chemisorptions.
Thermogravimetric Analysis (TGA) is a technique that measures weight changes in a material as it is heated or cooled. This analysis helps in understanding decomposition, stability, and purity of pharmaceutical compounds. TGA operates on the principle of monitoring mass changes with temperature, offering valuable insights into pharmaceutical processes and product characteristics. The instrumentation involves a thermobalance with a furnace and temperature control unit, which records a thermogram plot showing weight variation over temperature or time. Factors affecting TGA results include gas environment and heating rates, influencing the accuracy and interpretation of data. Despite certain drawbacks, TGA offers advantages like precise measurement and versatility in pharmaceutical research and development.

Download Presentation

Please find below an Image/Link to download the presentation.
The content on the website is provided AS IS for your information and personal use only. It may not be sold, licensed, or shared on other websites without obtaining consent from the author. Download presentation by click this link. If you encounter any issues during the download, it is possible that the publisher has removed the file from their server.
E N D
Presentation Transcript
Thermogravimetric Analysis (TGA) PRINCIPLE INSTRUMENTATION FACTORS AFFECTING RESULTS ADVANTAGES AND DISADVANTAGES PHARMACEUTICAL APPLICATIONS
Principle TGA measures the amount and the rate of weight change of a material with respect to temperature or time in controlled environments. The mass of a sample in a controlled atmosphere is recorded continuously as a function of temperature (or time) as the temperature of the sample is increased. TGA thermogram: -A plot of mass percent as a function of time or temperature. TGA measures the change in weight of a sample as it is heated, cooled or held at constant (isothermal) temperature.
PRINCIPLE A large number of chemical substances invariably decompose upon heating, and this heating a sample & observing weight change is the principle of thermogravimetric analysis (TGA). TGA may be sub-divided into two heads, namely : (a) Static (or Isothermal) Thermogravimetric Analysis, and (b) Dynamic Thermogravimetric Analysis. Static (Isothermal) Thermogravimetric Analysis The sample under analysis is maintained at a constant temperature for a period of time during which any changes in weight are observed carefully. Dynamic Thermogravimetric Analysis Sample is subjected to conditions of predetermined, carefully controlled continuous increase in temperature that is invariably found to be linear with time.
Thermogram: TG curve of a single stage Two Temperatures: Ti: initial lowest temperature at which the onset of a mass change is detected, procedural decomposition temperature Tf: Final T decomposition appear to be complete Ti-Tf difference: reaction interval
INSTRUMENT Instrument: is Thermobalance Data recorded in form of curve known as Thermogram . A TGA consists of three major parts (1) A sensitive analytical balance : Range : up to 100 mg. Sample holder is in furnace. However, the rest of the balance must be thermally isolated from the furnace. (2) furnace: Heating Device Temperature range: up to 1500 C. (3) Unit for temperature measurement & control (4) Recorder: automatic recording unit for the mass and temperature changes purge gas system : For prevention of oxidation: N2 Ar, He, etc. For oxidation: O2 or air.
Oven/heater for heating, ceramic rod/pan, and balance. Thermobalance components. The balance beam is shown as A. The sample cup and holder are B; C is a counterweight. D is a lamp and photodiodes, E is a magnetic coil, and F is a permanent magnet. The computer data-acquisition, data-processing, and control systems are components G, H, and I. Component J is the printer and display unit.
The TGA instrument continuously weighs a sample as it is heated to temperatures of up to 2000 C for coupling with FTIR and Mass spectrometry gas analysis.
Balances Basic : accuracy, sensitivity, reproducibility, and capacity Two types : (a) Null-point Type : incorporates a sensing element which detects a deviation of the balance beam from its null position A sensor detects the deviation and triggers the restoring force to bring the balance beam to back to the null position. The restoring force is directly proportional to the mass change. (b) Deflection Type : conversion of the balance beam deflection about the fulcrum into a suitable mass change trace by (a) photographic recording i.e change in path of a reflected beam of light available of photographic recording, (b) recording electrical signals generated by an appropriate displacement measurement transducer, and (c) using an electro-chemical device. The different balances used in TG instruments are having measuring range from 0.0001 mg to 1 g depending on sample containers used.
FURNACE The furnace and control system must be designed to produce linear heating at over the whole working temperature range of the furnace and provision must be made to maintain any fixed temperature. A wide temperature range generally 150-2000 C of furnaces is used in different instruments. The range of furnace basically depends on the types of heating elements are used. The temperature control of the furnace is satisfactorily achieved via a thermocouple mounted very close to the furnace-winding. The maximum operational temperature may be obtained by using different thermocouples as indicated below :
Temperature Measurement and Control Temperature measurement are commonly done using thermocouples , chromal alumel thermocouple are often used for temperature up to 1100 C whereas Pt/(Pt 10% Rh) is employed for temperature up to 1750 C. Temperature may be controlled or varied using a program controller with two thermocouple arrangement, the signal from one actuates the control system whilst the second thermocouple is used to record the temperature.
Recorder The recording device must be such so as to : (i) record both temperature and weight continuously, and (ii) make a definite periodic record of the time. Graphic recorders are preferred to meter type recorders. X-Y recorders are commonly used as they plot weight directly against temperature. Facilitate microprocessor controlled operation and digital data acquisition and processing using personal computer with different types recorder and plotter for better presentation of data.
schematic diagram of the specific balance and furnace assembly as a whole to better understand the working of a thermobalance. In this diagram, whole of the balance system is housed in a glass to protect it from dust and provide inert atmosphere. There is a control mechanism to regulate the flow of inert gas to provide inert atmosphere and water to cool the furnace. The temperature sensor of furnace is linked programme to control heating rates, etc. The balance thermocouple signal may be fed to recorder to record the TG Curve. to the output and
Thermogravimatic Curves Quantitative aspects of TG TG curves represent the variation in the mass (m) of the sample with the temperature (T) or time (t). Sometime we also record derivative thermogravimetric (DTG) Curves. A DTG curve presents the rate of mass change (dm/dt) as a function of temperature, or time (t) against T on the abscissa (x axis) as shown in Fig. when substance is heated at uniform rate. In this figure, the derivatives of the Curve is shown by dotted lines.
METHODOLOGY The thermogram for calcium oxalate monohydrate (CaC2O 4.H2O). The successive plateaus correspond to the anhydrous oxalate (100-250 C), calcium carbonate (400-500 C), and finally calcium oxide (700-850 C). In other words, these plateaus on the decomposition curve designate two vital aspects, namely : (a) clear indication of constant weight, and (b) stable phases within a specified temperature interval. The chemical reactions involved may be summarized as follows :
Interpretation of Thermogram the thermogravimetric evaluation of CaC2O4.H2O, it is ensured that the weight of this product decreases in several stages, namely :
Stage 1 : The water of hydration (or crystallization) from calcium oxalate monohydrate is lost which corresponds to 2.46 mg (12.3%) equivalent to 1 mole of H2O in the temperature range 100-250 C. Actually, the 12.3% weight loss that took place between 100-250 C should correspond to 12.3% of the original formula weight for CaCO3H2O (FW = 146). Hence, the product being lost has a formula weight of 0.123 146 = 17.958 (~_ 18.0), and it corresponds to H2O. Stage 2 : One mole of carbon monoxide is evolved subsequently from calcium oxalate, corresponding 2 to 3.84 mg (19.2%) in the temperature range 400-500 C. The 19.2% weight loss that occurred between 400-500 C should correspond to 19.2% of the original formula weight of 146. Therefore, the product being given out has a formula weight of 0.192 146 = 28.0, that corresponds to CO. Stage 3 : Finally, a mole of CO2is evolved from calcium carbonate that corresponds to 6.02 mg (3.01%) in the temperature range 700- 850 C.
FACTORS AFFECTING TG CURVE These factors may be due to instrumentation or nature of sample: 1. Instrumental factors: i) Furnace heating rate. ii) Recording or chart speed iii) Furnace atmosphere iv) Geometry of Sample holder/ location of sensors v) Sensitivity of recording mechanism. vi) Composition of sample container. 2. Sample Characteristics: a) Amount of sample b) Solubility of evolved gases in sample. c) Particle size d) Heat of reaction e) Sample packing f) Nature of sample g) Thermal conductivity.
Furnace heating rate At a given temperature, the degree of decomposition is greater at the slower heating rate, and thus it follows that the shape of the TG curve can be influenced by the heating rate. For a single stage endothermic reaction it has been found that F and S indicate fast and slow heating rate polystyrene decomposes 10% by mass when heating rate is 1 C per min by 357 C and 10% by mass when heating rate is 5 C per min by 394 C. Ti & Tf will decrease with decrease in heating rate and the TG curve will be shifted to the left. The appearance of an inflection in a TG curve at a fast heating rate may well be resolved into a plateau at a slower heating rate. Therefore, in TGA there is neither optimum no standard heating rate, but a heating rate of 3 C per min. gives a TG curve with maximum meaningful resolution.
Recording or chart speed The chart speed on the recording of the TG curve of rapid or slow reaction effects greatly on the shape of the TG curves. For a slow decomposition reaction: Low chart speed for recording the TG curve because at high chart speed the curve will be flattened and it will not show the sharp decomposition temperature. For a slow reaction followed by a rapid one: at the lower chart speed the curve will show less separation in the two steps than the higher chart speed curve. For fast-fast reaction followed by slower one similar observation are observed in shorter curve plateaus.
Furnace Atmosphere The effect of atmosphere on the TG curve depends on (i) The types of the reaction (ii) The nature of the decomposition products (iii) Type of the atmosphere employed. The effect of the atmosphere on TG curve may be illustrated by taking the example of thermo-decomposition of a sample of monohydrates of calcium oxalate in dry O2 and dry N2 as shown in fig. The small difference is due to difference in the nature/composition of CaCO3 formed in the two atmospheres. This is due to the particle size, surface area, lattice defects or due to the other physical characteristics of CaCO3 formed
Sample Holder Range from flat plates to deep crucible of various capacities. The shape of the TG curve vary as the sample will not be heated in identical condition. Generally, it is preconditioning that the thermocouple is placed on near the sample as possible and is not dipped into the sample because it might be spoiled due to sticking of the sample to the thermocouple on heating. So actual sample temperature is not recorded, it is the temperature at some point in the furnace near the sample. Thus it leads to source of error due to the thermal lag and partly due to the finite time taken to cause detectable mass change. If the sensitivity of recording mechanism is not enough to record the mass change of the sample then this will also cause error in recording the weight change of the sample. If the composition of the sample is such that it reacts either with the sample, or product formed or the evolved gases then this will cause error in recording the mass change of the sample.
Effect of Sample Mass The sample mass affects the TG curve in following i) The endothermic and exothermic reactions of the sample will cause sample temperature to deviate from a linear temperature change. ii) The degree of diffusion of evolved gases through the void space around the solid particles. iii) The existence of large thermal gradients throughout the sample particularly, if it has a low thermal conductivity. Thus, it is preferable to use as small a sample as possible depending on the sensitivity of the balance.
Effect of Sample Particle Size The particle size will cause a change in the diffusion of the evolved gases which will alter the reaction rate and hence the curve shape. The smaller the particle size, greater the extent of decomposition at any given temperature. The use of large crystal may result in apparent vary rapid mass loss during heating. This may be due to the mechanical loss of part of the sample by forcible ejection from the sample container, when the accumulated evolved gases within the coarse grains are suddenly released.
Effect of Heat of Reaction The heat of reaction will affect the extent to which sample temperature proceeds or succeeds the furnace temperature. This depends on whether the reaction is exothermic or endothermic and consequently the extent of decomposition will also be affected. The other sample characteristics such as sample packing, nature of the sample and its thermal conductivity will also affect the shape of TG curves. If the sample is packed loosely then the evolved gases may diffuse more easily than if the sample packed tightly. If the sample reacts with the sample container on heating then it will not give the mass of the product formed so the sample will change. We can avoid this effect by a sensible choice of sample container.
ADVANTAGES DISADVANTAGES Any type of solid can be analyzed With minimal sample preparation (at least 0.1mg) eg : powders, pellets, flakes TGA has high accuracy of balance used as well as precise control of heating/cooling rate and atmospheric condition TGA may be convenient and time saving, performance of technique does suffer due to construction requirements Easy sample changing and easy change of sample holder Fast heating rate with good resolution can be maintained In TGA one can hold the furnace at 1000 C without any balance drift, which is not balanced in other thermobalance Solid sample only must be used in quantitative and qualitative analysis Data interpretation is not always straight forward Very small Amount of samples are used but non-homogeneous material cannot be tested Sensitive to heating rate and sample masses results in shift in temperature Limited to sample which undergoes weight change.
APPLICATIONS Purity and thermal stability. Solid state reactions. Decomposition of inorganic and organic compounds. Determining composition of the mixture. Corrosion of metals in various atmosphere. Pyrolysis of coal, petroleum and wood. Roasting and calcinations of minerals. Reaction kinetics studies. Evaluation of gravimetric precipitates. Oxidative and reductive stability. Determining moisture, volatile and ash contents. Desolvation, sublimation, vaporizations, sorption, desorption, chemisorptions.
")


")