Testing Mars Company's Claims with Hypothesis Tests
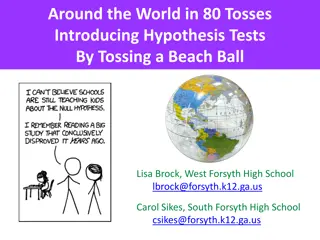
The Mars company makes claims about the percentage of colors in their M&M bags. By taking random samples and conducting hypothesis tests, we evaluate the validity of their claims. Follow the steps including formulating hypotheses, checking conditions, calculating p-values, and drawing conclusions based on significance levels. Explore whether their assertions hold true through statistical analysis.
Download Presentation

Please find below an Image/Link to download the presentation.
The content on the website is provided AS IS for your information and personal use only. It may not be sold, licensed, or shared on other websites without obtaining consent from the author.If you encounter any issues during the download, it is possible that the publisher has removed the file from their server.
You are allowed to download the files provided on this website for personal or commercial use, subject to the condition that they are used lawfully. All files are the property of their respective owners.
The content on the website is provided AS IS for your information and personal use only. It may not be sold, licensed, or shared on other websites without obtaining consent from the author.
E N D
Presentation Transcript
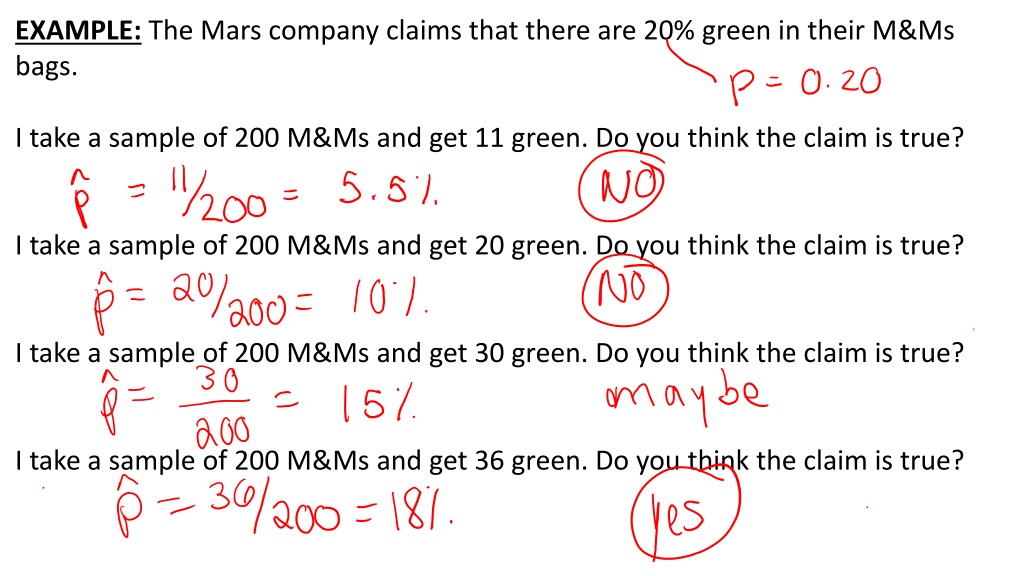
EXAMPLE: The Mars company claims that there are 20% green in their M&Ms bags. I take a sample of 200 M&Ms and get 11 green. Do you think the claim is true? I take a sample of 200 M&Ms and get 20 green. Do you think the claim is true? I take a sample of 200 M&Ms and get 30 green. Do you think the claim is true? I take a sample of 200 M&Ms and get 36 green. Do you think the claim is true?
Ch. 20: Tests of Significance OR Hypothesis Tests STEPS: (1) HYPOTHESES (2) CONDITIONS (3) MECHANICS (4) CONCLUSION
EXAMPLE: The M&M/MARS company claims that there are 30% orange in their bags. However, I do not believe them, since in my bags it seems like there are not that many oranges. I think they are not putting in enough oranges! Before I contact the company and complain, I want to gather some evidence. So, I take a random sample of 50 M&Ms and get 9 oranges. Do you think the company s claim is true? Or do you think I am right, and they are not putting in enough oranges? Justify! STEPS (1) Hypotheses: Null: Alternative:
(2) Conditions: Random success/failure 10% condition Statement:
(3) MECHANICS Z-score: Extreme Z-score?
P-Value: Calculation Definition: Probability of getting our sample (or something more extreme) assuming the claim is true What p-value is low enough to reject the claim?
(4) CONCLUSION Alpha = boundary level symbol = Common alpha levels = If no alpha level is given ... If p-value is LESS THAN alpha, then REJECT the claim If p-value is GREATER THAN alpha, then DO NOT REJECT the claim
Conclusion sentences: We reject the claim because the p-value of ______ is less than alpha = ______. We have sufficient evidence that (Ha, but in words/context!). OR We fail to reject the claim because the p-value of ____ is greater than alpha = ____. We do not have sufficient evidence that (Ha, but in words/context!). M&M example:
EXAMPLE 2: M&M/MARS claims that the true % of yellow is 14%. We feel that they may be overfilling the bag with yellow. We take a sample and find that 12 out of the 75 randomly sampled M&Ms are yellow. Is this enough evidence to say the true % of yellow M&Ms is higher than claimed?
EXAMPLE 3: M&M/MARS claims that the true % of blue is 24%! We dont believe them, but we are not sure if they are over or under filling the bag with blue. We take a sample and find that 10 out of the 60 randomly sampled M&Ms are blue. Is this enough evidence to say the true % of M&Ms is different than claimed?
EXAMPLE 4: It is generally believed that about 12% of children are nearsighted. A random sample of 150 children from a local school district is taken and 21 are found to be nearsighted. Does this show evidence that the school district has a higher percentage of nearsightedness than the national average?
EXAMPLE 5: A 1996 report stated that 90% all American homes have at least one smoke detector. A city's fire dept. has been running a public safety campaign, and wonders if this effort has increased the percentage of smoke detectors in homes. So building inspectors visit 400 randomly selected homes and find that 376 of them have smoke detectors. Is this strong evidence that the local rate is higher than the national rate?
EXAMPLE 6: The percent of male births has been claimed to be 52% in the US. There has been some changes in prenatal care over the past 10years, and we are wondering if the percent of male births has changed. We took a random sample of 550 births and found that 56.9% of them were male. Test the claim.
