TEMPO's Impact on Air Pollution Exposure Assessment & Health Effects Research
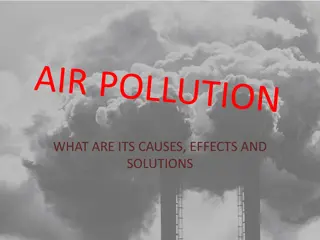
This presentation explores how the Total Ozone Mapping Spectrometer (TEMPO) contributes to assessing air pollution exposure and understanding its health effects, focusing on ozone. By integrating satellite data, TEMPO enhances exposure modeling and epidemiological research. The discussion includes insights into the health effects of acute and chronic ozone exposure, global estimates of the ozone burden, and key factors in exposure modeling, emphasizing study duration, temporal and spatial resolution.

Download Presentation

Please find below an Image/Link to download the presentation.
The content on the website is provided AS IS for your information and personal use only. It may not be sold, licensed, or shared on other websites without obtaining consent from the author. If you encounter any issues during the download, it is possible that the publisher has removed the file from their server.
You are allowed to download the files provided on this website for personal or commercial use, subject to the condition that they are used lawfully. All files are the property of their respective owners.
The content on the website is provided AS IS for your information and personal use only. It may not be sold, licensed, or shared on other websites without obtaining consent from the author.
E N D
Presentation Transcript
How can TEMPO Make a Difference in Air Pollution Exposure Assessment and Health Effects Research Yang Liu, Ph.D. TEMPO Health Applications Conference October 9 - 11, 2019 Huntsville, AL
Outline Outline The health effects of Ozone Based on EPA s Integrated Science Assessments Current applications of satellite ozone data in air quality health research Based on personal experience and peer-reviewed literature TEMPO s potentials In terms of exposure modeling and epi study Personal opinion based on my limited knowledge of TEMPO 2
The EPA ISA The Integrated Science Assessments (ISA) provide a synthesis and evaluation of the most policy-relevant science that builds the scientific foundation for the periodic review of the NAAQS. Determination Causal Interpretation Sufficient and conclusive evidence Sufficient evidence but with uncertainties Limited evidence Research Needs Not much research is needed in the US More research is needed Likely causal Suggestive More research is needed
Health Effects of O3 Acute exposure (i.e., hours, days, weeks): Source: EPA 600/R-10/076F, 2013
Health Effects of O3 Chronic exposure (i.e., months to years):
Summary of Current Knowledge Acute Exposure (i.e, hrs months) Causal / Likely Chronic Exposure (i.e., seasons - yrs) Likely / Suggestive O3
Global Estimates of Ozone burden Cohen et al. 2017: Exposure to ozone caused an additional 254,000 (95% UI 97 000 422 000) deaths and a loss of 4.1 million (1.6 million to 6.8 million) DALYs from chronic obstructive pulmonary disease in 2015. Anenberg et al. 2018: 9 23 million annual asthma emergency room visits globally in 2015 could be attributable to ozone, representing 8 20% of the annual number of global visits. Ozone exposure is CTM-based
Key Factors in Exposure Modeling Study duration Means sample size in acute studies Makes more accurate exposure estimates in chronic studies Temporal resolution Acute study NEEDS accurate short-term fluctuation of exposure Chronic study cares less about temporal resolution Spatial resolution Acute study can get more accurate effect estimates with high resolution exposure data Chronic study NEEDS accurate spatial gradient of exposure Accuracy and spatial coverage
Satellite Ozone Applications in Health OMI - very limited due to poor sensitivity in boundary layer and low correlation with ground observations Shen et al. 2018: OMI ozone is moderately correlated with ground ozone measurements in low latitude regions in China Might work together CTM profiles but very little has been done. Might be useful in estimating long-term Ozone burden
Satellite Ozone Applications in Health TROPOMI (work in progress, don t quote) Preliminary results on total column O3 are similar to OMI decent correlation with ground observations at low latitude after temporal averaging (r ~ 0.8 at monthly mean), no correlation in mid to high latitude. Challenges in matching the NAAQS standard (daily maximum 8-hour concentration or MDA8) Waiting for the tropospheric column and profile product Not suitable for studying intense episodes
Comparison of TROPOMI total column in CA with interpolated ground observations
Correlation of TROPOMI total O3 column with ground observations in 10/2018 in China Latitude Range 15 17.5 20 22.5 25 27.5 30 32.5 35 37.5 40 42.5 45 47.5 50 Correlation Coeff. 0.09 0.59 0.76 0.84 0.46 0.44 0.24 0.15 -0.32 -0.53 -0.07 -0.13 -0.17 0.49 -0.64 p-value 0.90 < 0.01 < 0.01 < 0.01 < 0.01 < 0.01 < 0.01 < 0.01 < 0.01 < 0.01 > 0.1 > 0.1 > 0.1 > 0.1 > 0.1 No. sites 4 39 174 244 304 432 372 300 292 245 170 111 61 11 5 20 22.5 25 27.5 30 32.5 35 37.5 40 42.5 45 47.5 50 52.5 55
TEMPOs Capabilities Duration: >= 2 years Temporal resolution: hourly or better Spatial resolution: 2.1 x 4.4 km2 native, 8.4 x 4.4 km2 for ozone profile Coverage: greater North America Precision: 5% for total ozone, 10 ppbv for profile
TEMPOs Potential Contributions O3 focus on acute effect studies Temporal resolution is great Spatial coverage is great Spatial resolution is good Duration is OK for national scale studies Challenge Need to estimate MDA8 values to be compatible with existing health study results Long-term possibility Mission length is not ideal for chronic studies but people will probably try it anyway
Going back to the question Exposure and health scientists will figure out ways to extract information from TEMPO data, and NASA should speed up this process and make it less painful.
Some food for thought Release synthetic data as soon as possible 0-2 km ozone most desired Multiple years of data are necessary to bring epidemiologists onboard Organize early adopters and provide data and technical support to produce successful public health applications Bring health people into the TEMPO science team to ensure long-term success