Systems Diagrams Complexity: Carbon Cycle & Whale Pump
Explore labeling and measuring complexities in systems diagrams exemplified by the Carbon Cycle and Whale Pump. Understand the interconnected reservoirs, sources, sinks, and feedback loops with quantifiable relationships and measurable quantities. Dive into the intricate networks of matter and energy flows within these ecological systems.
Download Presentation

Please find below an Image/Link to download the presentation.
The content on the website is provided AS IS for your information and personal use only. It may not be sold, licensed, or shared on other websites without obtaining consent from the author.If you encounter any issues during the download, it is possible that the publisher has removed the file from their server.
You are allowed to download the files provided on this website for personal or commercial use, subject to the condition that they are used lawfully. All files are the property of their respective owners.
The content on the website is provided AS IS for your information and personal use only. It may not be sold, licensed, or shared on other websites without obtaining consent from the author.
E N D
Presentation Transcript
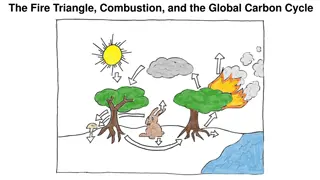
How to Label a Systems Diagram Moving toward greater complexity within systems diagrams. Example of The Carbon Cycle
The Carbon Cycle http://www.esrl.noaa.gov/gmd/outreach/carbon_toolkit/basics.html
The Carbon Cycle With Labels Reservoir Source Sink Feedback Feedback Source Reservoir Sink Feedback Source Reservoir Source Source Reservoir Source Feedback Others? Reservoir Sink http://www.esrl.noaa.gov/gmd/outreach/carbon_toolkit/basics.html
The Carbon Cycle With Measurable Quantities Identified ppm Value Can Be Measured % reflectivity g/m3 mm/hr mm/hr Units of Measured Quantity ppm g/m2 lbs CO2/kWh houses/mi2 % coverage W vehicles/hr % cultivated land L/hr g C/kg soil g C/m3 Others? mg/L g C/m3 mm/year http://www.esrl.noaa.gov/gmd/outreach/carbon_toolkit/basics.html
The Carbon Cycle With Quantifiable Relationships Identified Rate/Flux Can Be Determined Rate/Flux Can Be Determined Others? Flux = The rate of matter or energy movement (amount per unit time) http://www.esrl.noaa.gov/gmd/outreach/carbon_toolkit/basics.html
How to Label a Systems Diagram Moving toward greater complexity within systems diagrams. Example of The Whale Pump
The Whale Pump Roman J, McCarthy JJ - Roman J, McCarthy JJ (2010) The Whale Pump: Marine Mammals Enhance Primary Productivity in a Coastal Basin. PLoS ONE 5(10): e13255. doi:10.1371/journal.pone.0013255
The Whale Pump With Labels Source Source Reservoir Feedback Sink Reservoir Feedback Reservoir Reservoir Feedback Reservoir Feedback Others? Reservoir Reservoir Sink Source Source Reservoir Roman J, McCarthy JJ - Roman J, McCarthy JJ (2010) The Whale Pump: Marine Mammals Enhance Primary Productivity in a Coastal Basin. PLoS ONE 5(10): e13255. doi:10.1371/journal.pone.0013255
The Whale Pump With Measurable Quantities Identified Value Can Be Measured gC/m3 gC/m3 gC/m3 mg/L gC/m3 Units of Measured Quantity mg/L mg/L gC/m3 gC/m3 ppm gC/m3 gC/m3 Others? gC/m3 gC/m3 gC/m3 Roman J, McCarthy JJ - Roman J, McCarthy JJ (2010) The Whale Pump: Marine Mammals Enhance Primary Productivity in a Coastal Basin. PLoS ONE 5(10): e13255. doi:10.1371/journal.pone.0013255
The Whale Pump With Quantifiable Relationships Identified Humans Rate/Flux Can Be Determined Squid Rate/Flux Can Be Determined Others? Flux = The rate of matter or energy movement (amount per unit time) Roman J, McCarthy JJ - Roman J, McCarthy JJ (2010) The Whale Pump: Marine Mammals Enhance Primary Productivity in a Coastal Basin. PLoS ONE 5(10): e13255. doi:10.1371/journal.pone.0013255
How to Label a Systems Diagram Moving toward greater complexity within systems diagrams. Example of The Cryosphere
The Cryosphere Frozen Water Liquid Water Atmosphere Surface Ice Glacier Snow Sea Ice Ice Sheet Lake Ice Icebergs Perma- frost River Ice Ocean Deborah Gross, Carleton College, and Karl Kreutz, University of Maine, 2015.
The Cryosphere With Labels Feedback Frozen Water Source Liquid Water Sink Feedback Atmosphere Source Sink Surface Ice Feedback Feedback Reservoir Reservoir Feedback Reservoir Glacier Snow Sea Ice Ice Sheet Lake Ice Reservoir Reservoir Reservoir Icebergs Perma- frost Reservoir River Ice Ocean Reservoir Others? Deborah Gross, Carleton College, and Karl Kreutz, University of Maine, 2015.
The Cryosphere With Measurable Quantities Identified Frozen Water Value Can Be Measured Liquid Water m/yr Gt/yr Atmosphere Surface Ice Units of Measured Quantity Gt/yr Glacier Snow Sea Ice Ice Sheet Lake Ice m Icebergs Gt/yr m/yr Perma- frost River Ice m m Ocean Others? Deborah Gross, Carleton College, and Karl Kreutz, University of Maine, 2015.
The Cryosphere With Quantifiable Relationships Identified Frozen Water Rate/Flux Can Be Determined Liquid Water Atmosphere Surface Ice Glacier Snow Sea Ice Ice Sheet Rate/Flux Can Be Determined Lake Ice Icebergs Perma- frost River Ice Ocean Others? Flux = The rate of matter or energy movement (amount per unit time) Deborah Gross, Carleton College, and Karl Kreutz, University of Maine, 2015.
