Supplemental Brain Images

Supplemental Brain Images
Online resources for Clinical Neuropsychology: A Pocket Handbook for
Assessment, Third Edition
Michael W. Parsons, PhD and Thomas A. Hammeke, PhD

Supplemental Figure 4.1i: Mengioma case example.
Supplemental Figure 4.2i: Mengioma case example.
Supplemental Figure 4.3i: Mengioma case example.
Supplemental Figure 4.4i: CT images—Skull fracture secondary
to trauma.
Supplemental Figure 4.5i: CT images—Foreign body.
Supplemental Figure 4.6i: CT images—Intracranial blood secondary
to hemorrhage. Blood appears as a hazy bright substance in the
subarachnoid spaces at the base of the brain.
Supplemental Figure 4.7i: CT images—Intracranial blood secondary
to hemorrhage. Blood appear in the sulcal space at a more superior
level in a patient with diffuse hemorrhage.
Supplemental Figure 4.8i: CT images—intracranial blood secondary
to hemorrhage. A focal intraparenchymal hemorrhage produces a
more densely bright focus in the right frontal lobe of another patient.
Supplemental Figure 4.9i: CT images—intracranial blood
secondary to trauma.
Supplemental Figure 4.10i: CT images—Intracranial localization of
electrodes. Contact point on the electrode creates a metallic “spray”
artifact.
Supplemental Figure 4.11i: CT images—Intracranial localization of
electrodes. A three-dimensional CT reconstruction illustrating
electrode placement superficially.
Supplemental Figure 4.12i: CT images of abnormal basal ganglia,
thalamic, white matter, and cerebellar calcification in a patient with
Fahr’s syndrome.
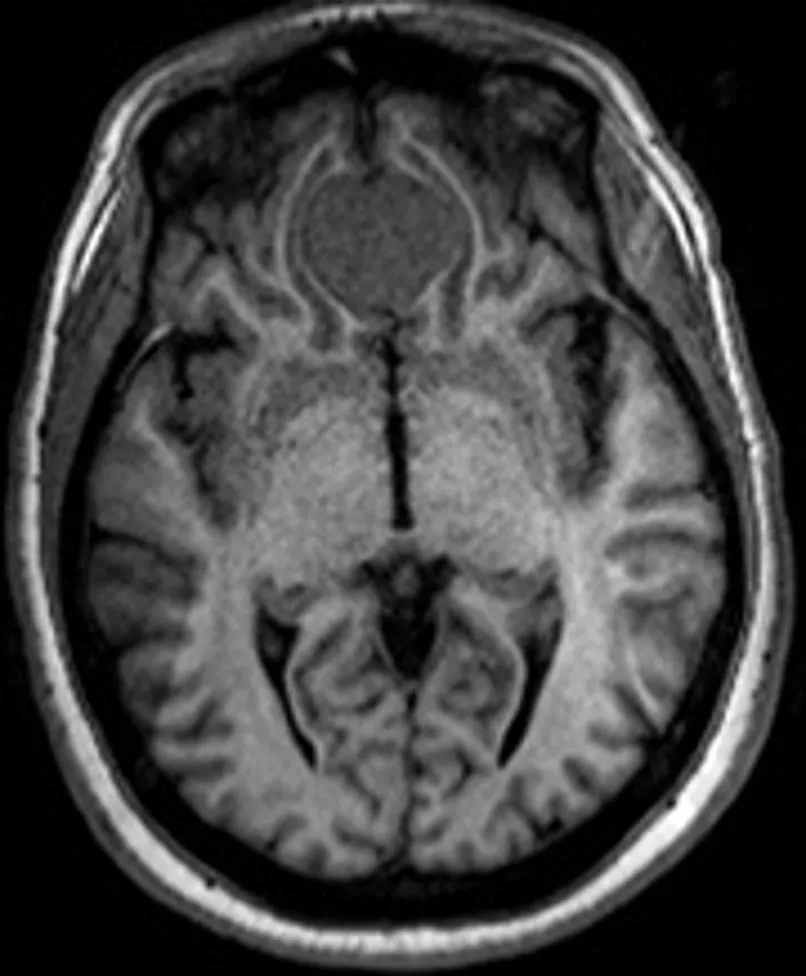
Supplemental Figure 4.13i: MR images—Normal tissue
contrasts—T1 Axial.
Supplemental Figure 4.14i: MR images—Normal tissue
contrasts—T1 Coronal.
Supplemental Figure 4.15i: MR images—Normal tissue
contrasts—T1 Sagittal.
Supplemental Figure 4.16i: MR images—Normal tissue
contrasts—T2.
Supplemental Figure 4.17i: MR images—Normal tissue
contrasts—FLAIR.
Supplemental Figure 4.18i: MR images—Normal tissue
contrasts—Proton Density.
Supplemental Figure 4.19i: MR images—Stroke—Acute—T2.
Supplemental Figure 4.20i: MR images—Stroke—Acute—
FLAIR.
Supplemental Figure 4.21i: MR images—Stroke—Acute—DWI.
Supplemental Figure 4.22i: MR images—Stroke—Acute—ADC.
Supplemental Figure 4.23i: MR images—Stroke—Remote—T1.
Supplemental Figure 4.24i: MR images—Stroke—Remote—T2.
Supplemental Figure 4.25i: MR images—Stroke—Remote—
FLAIR.
Supplemental Figure 4.26i: MR images—Stroke—Remote—
DWI.
Supplemental Figure 4.27i: MR images—Stroke—Remote—
ADC.
Supplemental Figure 4.28i: MR images—Stroke—
Hemorrhagic—T1.
Supplemental Figure 4.29i: MR images—Stroke—
Hemorrhagic—T2.
Supplemental Figure 4.30i: MR images—Stroke—
Hemorrhagic—FLAIR.
Supplemental Figure 4.31i: MR images—Stroke—
Hemorrhagic—DWI.
Supplemental Figure 4.32i: MR images—Stroke—
Hemorrhagic—SWI.
Supplemental Figure 4.33i: MR images—Traumatic
hemorrhage—TI.
Supplemental Figure 4.34i: MR images—Traumatic
hemorrhage—T2.
Supplemental Figure 4.35i: MR images—Traumatic
hemorrhage—FLAIR.
Supplemental Figure 4.36i: MR images—Traumatic
hemorrhage—SWI.
Supplemental Figure 4.37i: MR images—Low grade brain
tumor—T1.
Supplemental Figure 4.38i: MR images—Low grade brain
tumor—T2.
Supplemental Figure 4.39i: MR images—Low grade brain
tumor—FLAIR.
Supplemental Figure 4.40i: MR images—Low grade brain
tumor—T1 Contrast.
Supplemental Figure 4.41i: MR images—High grade brain
tumor—T1.
Supplemental Figure 4.42i: MR images—High grade brain
tumor—T2.
Supplemental Figure 4.43i: MR images—High grade brain
tumor—FLAIR.
Supplemental Figure 4.44i: MR images—High grade brain
tumor—T1 Contrast.
Supplemental Figure 4.45i: MR images—High grade brain
tumor—CBF.
Supplemental Figure 4.46i: MR images—High grade brain
tumor—Radiation necrosis—FLAIR.
Supplemental Figure 4.47i: MR images—High grade brain
tumor—Radiation necrosis—T1 Contrast.
Supplemental Figure 4.48i: MR images—High grade brain
tumor—Radiation necrosis—Cerebral blood flow.
Supplemental Figure 4.49i: MR images—Multiple sclerosis—
T1.
Supplemental Figure 4.50i: MR images—Multiple sclerosis—
T2.
Supplemental Figure 4.51i: MR images—Multiple sclerosis—
FLAIR.
Supplemental Figure 4.52i: MR images—Multiple sclerosis—
T1 Contrast.
Supplemental Figure 4.53i: MR images—Multiple sclerosis—
Active lesions—T1.
Supplemental Figure 4.54i: MR images—Multiple sclerosis—
Active lesions—T2.
Supplemental Figure 4.55i: MR images—Multiple sclerosis—
Active lesions—FLAIR.
Supplemental Figure 4.56i: MR images—Multiple sclerosis—
Active lesions—T1 Contrast.
Supplemental Figure 4.57i: MR images—Dementia—
Alzheimer’s disease.
Supplemental Figure 4.58i: MR images—Dementia—Normal
pressure hydrocephalus—T2.
Supplemental Figure 4.59i: MR images—Dementia—Normal
pressure hydrocephalus—FLAIR.
Supplemental Figure 4.60i: MR images—Small vessel
disease—FLAIR.
Supplemental Figure 4.61i: MR images—Hippocampal
sclerosis in epilepsy—T1.
Supplemental Figure 4.62i: MR images—Hippocampal
sclerosis in epilepsy—T2.
Supplemental Figure 4.63i: MR images—Hippocampal
sclerosis in epilepsy—FLAIR.
Supplemental Figure 4.64i: MR images—Hippocampal
sclerosis in epilepsy—FLAIR.
Supplemental Figure 4.65i: MR images—Major white matter
fiber bundles.
Supplemental Figure 4.66i: MR images—Magnetic resonance
spectroscopy.
Supplemental Figure 4.67i: Functional MRI—Memory task.
Supplemental Figure 4.68i: Functional MRI—Hand motor task.
Supplemental Figure 4.69i: Functional MRI—Language
comprehension task.
This pocket handbook features a collection of supplemental brain images relevant to clinical neuropsychology assessment. The images cover various cases such as mengioma examples, skull fractures, intracranial blood from hemorrhages, foreign bodies, and electrode localization.

Download Presentation

Please find below an Image/Link to download the presentation.
The content on the website is provided AS IS for your information and personal use only. It may not be sold, licensed, or shared on other websites without obtaining consent from the author.If you encounter any issues during the download, it is possible that the publisher has removed the file from their server.
You are allowed to download the files provided on this website for personal or commercial use, subject to the condition that they are used lawfully. All files are the property of their respective owners.
The content on the website is provided AS IS for your information and personal use only. It may not be sold, licensed, or shared on other websites without obtaining consent from the author.
E N D
Presentation Transcript
Supplemental Brain Images Online resources for Clinical Neuropsychology: A Pocket Handbook for Assessment, Third Edition Michael W. Parsons, PhD and Thomas A. Hammeke, PhD
Supplemental Figure 4.4i: CT imagesSkull fracture secondary to trauma.
Supplemental Figure 4.6i: CT imagesIntracranial blood secondary to hemorrhage. Blood appears as a hazy bright substance in the subarachnoid spaces at the base of the brain.
Supplemental Figure 4.7i: CT imagesIntracranial blood secondary to hemorrhage. Blood appear in the sulcal space at a more superior level in a patient with diffuse hemorrhage.
Supplemental Figure 4.8i: CT imagesintracranial blood secondary to hemorrhage. A focal intraparenchymal hemorrhage produces a more densely bright focus in the right frontal lobe of another patient.
Supplemental Figure 4.9i: CT imagesintracranial blood secondary to trauma.
Supplemental Figure 4.10i: CT imagesIntracranial localization of electrodes. Contact point on the electrode creates a metallic spray artifact.
Supplemental Figure 4.11i: CT imagesIntracranial localization of electrodes. A three-dimensional CT reconstruction illustrating electrode placement superficially.
Supplemental Figure 4.12i: CT images of abnormal basal ganglia, thalamic, white matter, and cerebellar calcification in a patient with Fahr s syndrome.
Supplemental Figure 4.13i: MR imagesNormal tissue contrasts T1 Axial.
Supplemental Figure 4.14i: MR imagesNormal tissue contrasts T1 Coronal.
Supplemental Figure 4.15i: MR imagesNormal tissue contrasts T1 Sagittal.
Supplemental Figure 4.16i: MR imagesNormal tissue contrasts T2.
Supplemental Figure 4.17i: MR imagesNormal tissue contrasts FLAIR.
Supplemental Figure 4.18i: MR imagesNormal tissue contrasts Proton Density.
Supplemental Figure 4.28i: MR imagesStroke Hemorrhagic T1.
Supplemental Figure 4.29i: MR imagesStroke Hemorrhagic T2.
Supplemental Figure 4.30i: MR imagesStroke Hemorrhagic FLAIR.
Supplemental Figure 4.31i: MR imagesStroke Hemorrhagic DWI.
Supplemental Figure 4.32i: MR imagesStroke Hemorrhagic SWI.
Supplemental Figure 4.33i: MR imagesTraumatic hemorrhage TI.
Supplemental Figure 4.34i: MR imagesTraumatic hemorrhage T2.
Supplemental Figure 4.35i: MR imagesTraumatic hemorrhage FLAIR.
Supplemental Figure 4.36i: MR imagesTraumatic hemorrhage SWI.
Supplemental Figure 4.37i: MR imagesLow grade brain tumor T1.
Supplemental Figure 4.38i: MR imagesLow grade brain tumor T2.
Supplemental Figure 4.39i: MR imagesLow grade brain tumor FLAIR.
Supplemental Figure 4.40i: MR imagesLow grade brain tumor T1 Contrast.
Supplemental Figure 4.41i: MR imagesHigh grade brain tumor T1.
Supplemental Figure 4.42i: MR imagesHigh grade brain tumor T2.
Supplemental Figure 4.43i: MR imagesHigh grade brain tumor FLAIR.
Supplemental Figure 4.44i: MR imagesHigh grade brain tumor T1 Contrast.
Supplemental Figure 4.45i: MR imagesHigh grade brain tumor CBF.
Supplemental Figure 4.46i: MR imagesHigh grade brain tumor Radiation necrosis FLAIR.
Supplemental Figure 4.47i: MR imagesHigh grade brain tumor Radiation necrosis T1 Contrast.
Supplemental Figure 4.48i: MR imagesHigh grade brain tumor Radiation necrosis Cerebral blood flow.