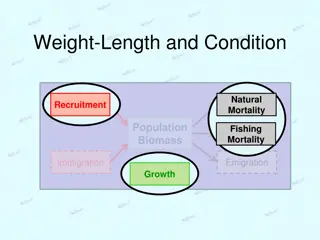
Success in ML Systems through Goals and Metrics

Defining Success with ML
Systems
Geoff Hutlen

Goal for SMS spam


Operating Point: 1% FPR


Block > 95% of the spam


Train a model like this and you’ve got
victory!

What Could Go Wrong?
•
Maybe these aren’t the right targets
•
Users hate it
•
Spammers ignore it
•
Maybe the problem changes
•
Spammers send 20x more spam…
•
Spammers send 20x less spam…
•
Maybe the FPs are distributed poorly…
•
Totally shut down all bank statements
•
Totally shut down all small senders
•
Maybe no one knows what you're talking about…
•
Management has no idea what a FN is
•
Move FN metric, but don’t move business metric
Wrong metrics?
- Same FNR, more spam
- Same FPR, less value
- PR better?

Wrong operating points?
- 0.5% FPR better?
- 1.0% FNR better?

Wrong test data?
- Missing critical sub-populations?
- Some errors more costly than others?


Delta:
Wrong vocabulary / concepts?
- Technical terms don’t map across participants
- ML goals not tied to actual goals

Properties of a Good Goal
Communicate desired outcome
•
What is success and why is it important
•
In the language of all participants
Achievable
•
Participants can see a path toward success
•
Even if it’s difficult…
Measurable
•
Quantify benefit of progress and cost of failure
•
Evaluation is creation
New “mysterious” ML
vocabulary added to discussions
ML requires new intuitions about
what is easy and what is hard
ML just another tool, not a magic
problem solving box
Setting the
right goals
for ML is just about the hardest, most
frustrating and
most important
part of using ML in practice
More Detail on SMS Spam
What the Model Does
What the User Sees
1% FPR
5% FNR
1 FP per week
50 inbox spam per week
Inbox ~33% Spam
What the World Does
100 Non-Spam Per Week
1000 Spam Per Week
Spammers who know about you
Friends who message you
Types of goals
Precision = 99%
FNR < 5% & 1% FPR
‘bad’ FPR < 0.1%
Total cost (FP 10; FN 1)
User sees fewer than 5 spam a week
Users spend less of 2% of time in app on spam
Avg User Inbox < 5% spam
User sees less spam than on competitor
New spam attack stopped in < 1 hour
Cost of managing spam < 1% of service cost
User studies show 80% think we’re good at spam
Avg User reports < 1 spam a month
Users recommend the service to their friends
Monthly Active Users
Subscription Revenue Growth
Monthly Sent per User
User Churn
Profit
Model Properties
User Outcomes
Organizational Objectives
Leading Indicators
Models + UX Create
Good Outcomes
Improve
Happy, Engaged
Users Lead to
Connecting Model Properties to User Outcomes
Model Properties
User Outcomes
Will change over time
Current FN Rate
Complex Relationship over Time
Short Term Gradient
~4-5 points of ‘%
Inbox is Spam’
per point of FNR
Connecting Outcomes to Leading Indicators
Model Properties
User Outcomes
Leading Indicators
Bad User Outcomes with
large effect on sentiment
Diminishing Effect of Bad User
Outcomes on sentiment
Affected by many things
and changes slowly
Don’t expect model launch
to change it overnight
Connecting Outcomes to Leading Indicators
Model Properties
User Outcomes
Leading Indicators
Bad User Outcomes with
large effect on sentiment
Diminishing Effect of Bad User
Outcomes on sentiment
Work on other problems:
- FPR
- Latency
- Cost to run
Putting it Together
Model Properties
User Outcomes
Leading Indicators
Organizational Objectives
1% of FNR
4-5 points of ‘% of Inbox is Spam’
.5 of a star rating
10k Monthly Saving
2% of User Churn
Setting a goal
for your ML
Why not Optimize Actual Goal Directly?
•
Indirect Relationship
•
Effect of single actions small
•
Long delay for feedback
•
Affected by many things
•
User Experience
•
Competitors
•
Marketing
•
Interactions with other parts of the
system
•
Changing concepts
•
Relatively few observations
•
ML on Concrete Sub-problem
•
Large (local) effect of actions
•
Quick feedback
•
Context contains most of the
relevant info
•
Can get quick implicit feedback
•
Can inspect context and hand-label
•
Many, many observations
Summary
•
Setting goals for ML systems is
frustrating, difficult, and critical
•
Good goals:
•
Communicate success
•
Inspire participants
•
Are Measurable
•
Hierarchy of Goals
•
Model properties
user
outcomes
leading indicators
organizational success
•
Global relationships complex,
local approximations help
•
Need to invest to keep goals
healthy over time
Explore the importance of setting good goals in ML systems, the connection between model properties and user outcomes, and the impact of achieving desired outcomes in SMS spam detection. Learn about defining success, types of goals, and ensuring measurable and achievable objectives for ML implementation.

Download Presentation

Please find below an Image/Link to download the presentation.
The content on the website is provided AS IS for your information and personal use only. It may not be sold, licensed, or shared on other websites without obtaining consent from the author. Download presentation by click this link. If you encounter any issues during the download, it is possible that the publisher has removed the file from their server.
E N D
Presentation Transcript
Defining Success with ML Systems Geoff Hutlen
Goal for SMS spam Train a model like this and you ve got victory! Operating Point: 1% FPR Block > 95% of the spam Wrong operating points? - 0.5% FPR better? - 1.0% FNR better? False Positive Rate What Could Go Wrong? 0% 1% 2% 3% 4% 5% 0% 5% Maybe these aren t the right targets Users hate it Spammers ignore it Wrong metrics? - Same FNR, more spam - Same FPR, less value - PR better? 10% 15% False Negative Rate Delta: 20% Maybe the problem changes Spammers send 20x more spam Spammers send 20x less spam 25% 30% 35% 40% Maybe the FPs are distributed poorly Totally shut down all bank statements Totally shut down all small senders Wrong test data? - Missing critical sub-populations? - Some errors more costly than others? 45% 50% Model 1 Model 2 Maybe no one knows what you're talking about Management has no idea what a FN is Move FN metric, but don t move business metric Wrong vocabulary / concepts? - Technical terms don t map across participants - ML goals not tied to actual goals
Properties of a Good Goal Communicate desired outcome What is success and why is it important In the language of all participants New mysterious ML vocabulary added to discussions Achievable Participants can see a path toward success Even if it s difficult ML requires new intuitions about what is easy and what is hard ML just another tool, not a magic problem solving box Measurable Quantify benefit of progress and cost of failure Evaluation is creation Setting the right goals for ML is just about the hardest, most frustrating and most important part of using ML in practice
More Detail on SMS Spam 100 Non-Spam Per Week 1000 Spam Per Week 1% FPR 5% FNR 1 FP per week 50 inbox spam per week Friends who message you Spammers who know about you What the Model Does What the User Sees What the World Does Inbox ~33% Spam
Types of goals Model Properties User Outcomes User Churn Profit Models + UX Create Leading Indicators Organizational Objectives Cost of managing spam < 1% of service cost Avg User reports < 1 spam a month Happy, Engaged Users Lead to
Connecting Model Properties to User Outcomes Will change over time 1000 Spam vs 100 Good 50% 45% 40% Current FN Rate ~4-5 points of % Inbox is Spam per point of FNR 35% % Inbox is Spam 30% 25% 20% User Outcomes 15% 10% Complex Relationship over Time Short Term Gradient 5% 0% Model Properties 0% 1% 2% 3% 4% 5% 6% 7% 8% 9% 10% FN Rate
Connecting Outcomes to Leading Indicators Diminishing Effect of Bad User Outcomes on sentiment Bad User Outcomes with large effect on sentiment 5 5 4.5 4.5 4 4 Star Rating Star Rating Leading Indicators 3.5 3.5 User Outcomes 3 3 2.5 2.5 0% 0% 5% 5% 10% 10% 15% 15% 20% 20% 25% 25% 30% 30% 35% 35% 40% 40% 45% 45% 50% 50% Model Properties % Inbox is Spam % Inbox is Spam Affected by many things and changes slowly Don t expect model launch to change it overnight
Connecting Outcomes to Leading Indicators 1000 Spam vs 100 Good Bad User Outcomes with large effect on sentiment 50% 40% % Inbox is Spam 30% 5 20% 10% 4.5 Leading Indicators 0% 0% 2% 4% 6% 8% 10% 4 Star Rating FN Rate 3.5 User Outcomes 3 2.5 Diminishing Effect of Bad User Outcomes on sentiment Work on other problems: - FPR - Latency - Cost to run 0% 10% 20% 30% 40% 50% Model Properties % Inbox is Spam
Putting it Together Setting a goal for your ML 2% of User Churn 10k Monthly Saving Organizational Objectives .5 of a star rating Leading Indicators 4-5 points of % of Inbox is Spam User Outcomes Model Properties 1% of FNR
Why not Optimize Actual Goal Directly? Indirect Relationship Effect of single actions small Long delay for feedback Affected by many things User Experience Competitors Marketing Interactions with other parts of the system Changing concepts Relatively few observations ML on Concrete Sub-problem Large (local) effect of actions Quick feedback Context contains most of the relevant info Can get quick implicit feedback Can inspect context and hand-label Many, many observations
Summary Setting goals for ML systems is frustrating, difficult, and critical Hierarchy of Goals Model properties user outcomes leading indicators organizational success Good goals: Communicate success Inspire participants Are Measurable Global relationships complex, local approximations help Need to invest to keep goals healthy over time