Statistics Insights: 100m Results at 2012 London Olympics Analysis
Explore detailed statistics from the 2012 London Olympics, including 100m race results, cumulative frequencies, and analysis of time distributions. Learn about Cumulative Frequency Graphs and estimating data characteristics like the median, lower quartile, and upper quartile. Understand the concept of cumulative frequencies and their importance in data analysis.

Download Presentation

Please find below an Image/Link to download the presentation.
The content on the website is provided AS IS for your information and personal use only. It may not be sold, licensed, or shared on other websites without obtaining consent from the author. Download presentation by click this link. If you encounter any issues during the download, it is possible that the publisher has removed the file from their server.
E N D
Presentation Transcript
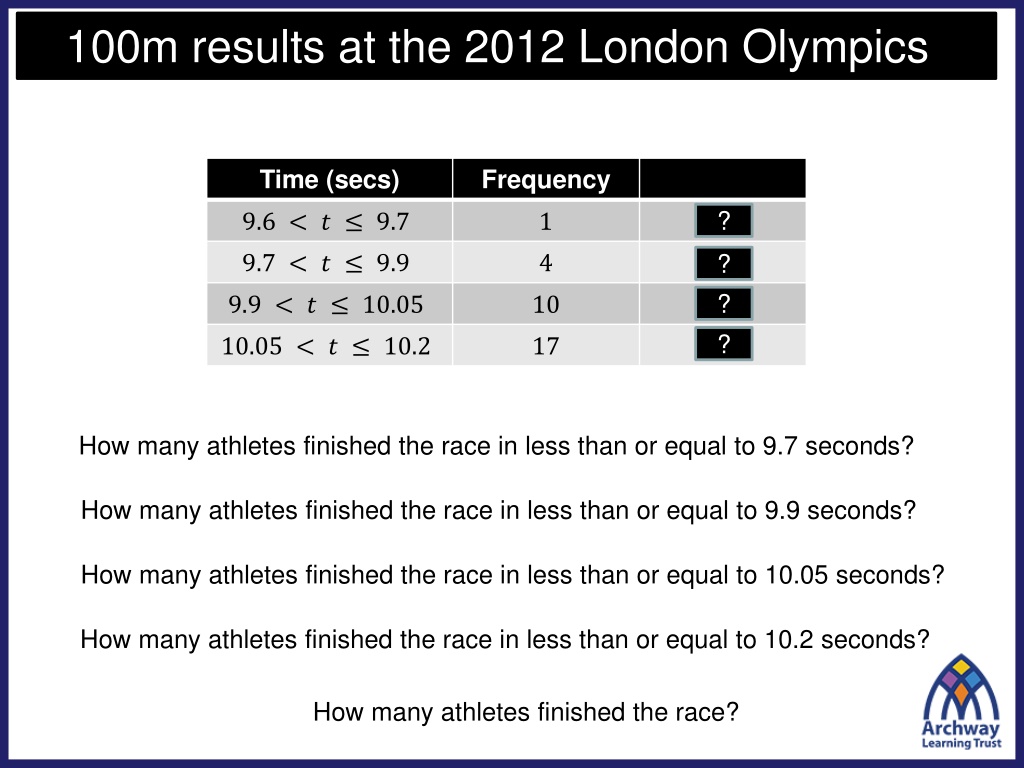
100m results at the 2012 London Olympics Time (secs) Frequency 1 ? 9.6 < ? 9.7 1 5 ? ? ? 9.7 < ? 9.9 4 9.9 < ? 10.05 10 15 10.05 < ? 10.2 17 32 How many athletes finished the race in less than or equal to 9.7 seconds? How many athletes finished the race in less than or equal to 9.9 seconds? How many athletes finished the race in less than or equal to 10.05 seconds? How many athletes finished the race in less than or equal to 10.2 seconds? How many athletes finished the race?
100m results at the 2012 London Olympics Time (secs) Frequency CF 9.6 < ? 9.7 1 1 9.7 < ? 9.9 4 5 9.9 < ? 10.05 10 15 10.05 < ? 10.2 17 32 These values are known as Cumulative Frequencies. Synonyms for the word cumulative include the words increasing, accumulative and growing. The Cumulative Frequency column represents a running total .
100 people recorded the number of hours in a week they spent using a computer. The table shows the results. Time (hours) Frequency CF 0 < ? 5 20 20 5 < ? 10 30 50 10 < ? 15 45 95 15 < ? 20 5 100 On your whiteboard, write down the Cumulative Frequency values.
40 people recorded the number of hours in a week they spent on social media. The table shows the results. Time (hours) Frequency CF 0 < ? 5 20 4 5 < ? 10 30 20 10 < ? 15 45 36 ? 15 < ? 20 5 40 On your whiteboard, write down the missing value.
40 people recorded the number of hours in a week they spent on social media. The table shows the results. Time (hours) Frequency ? CF 0 < ? 5 4 ? ? ? 4 5 < ? 10 16 20 10 < ? 15 16 36 15 < ? 20 4 40 On your whiteboard, write down the missing frequency values.
100m results at the 2012 London Olympics Time (secs) Frequency CF 9.6 < ? 9.7 1 1 9.7 < ? 9.9 4 5 9.9 < ? 10.05 10 15 10.05 < ? 10.2 17 32 A Cumulative Frequency Graph can be drawn and then used to estimate information about the data set. Useful information that be estimated from a Cumulative Frequency Graph includes the median, lower quartile and upper quartile.
Time (s) Frequency Cum Freq 9.6 < t 9.7 1 1 Plot 9.7 < t 9.9 4 5 Plot 9.9 < t 10.05 10 15 Plot 32 Plot 10.05 < t 10.2 17 32 ? 28 Median = 10.07s Cumulative Frequency 24 Lower Quartile = 9.95s ? 20 16 Upper Quartile = 10.13s ? 12 8 Interquartile Range = 0.18s ? 4 0 9.5 9.6 9.7 9.8 9.9 10.0 10.1 10.2 10.3 Time (s)
The heights of 40 plants were recorded. The table shows the results. Time (hours) Frequency CF 170 < ? 175 5 5 175 < ? 180 18 23 180 < ? 185 12 35 185 < ? 190 4 39 185 < ? 190 1 40 On your whiteboard, write down the five coordinates that would be required to sketch the Cumulative Frequency Graph.
Title: Cumulative Frequency Graphs Cumulative Frequency values are calculated by working out a running total of the frequency values. When plotting a Cumulative Frequency Graph the upper limit of the group is plotted The median, lower and upper quartiles can be estimated from a Cumulative Frequency Graph. The Interquartile Range can also be estimated: ??? = ?3 ?1 Missing words include: interquartile, upper, frequency, median, running total, estimated, group
In your books: 1. Complete the Cumulative Frequency Table 2. Draw the Cumulative Frequency Graph 3. Estimate the Median mass 4. Estimate the Interquartile Range
Mark your work: Median 83 Interquartile Range 89 76 = 13


")


