Speed-Time Graphs Analysis - A Journey Through Various Vehicles
Explore the intriguing journeys of different vehicles through speed-time graphs. Witness the bicycle's sudden stop, the car's acceleration to reach 60 km/h, and the toy vehicle's varying accelerations and decelerations. Learn about constant speeds, maximum speeds, and durations of stationary and fastest drives, offering a unique insight into the motion of these vehicles.

Download Presentation

Please find below an Image/Link to download the presentation.
The content on the website is provided AS IS for your information and personal use only. It may not be sold, licensed, or shared on other websites without obtaining consent from the author.If you encounter any issues during the download, it is possible that the publisher has removed the file from their server.
You are allowed to download the files provided on this website for personal or commercial use, subject to the condition that they are used lawfully. All files are the property of their respective owners.
The content on the website is provided AS IS for your information and personal use only. It may not be sold, licensed, or shared on other websites without obtaining consent from the author.
E N D
Presentation Transcript
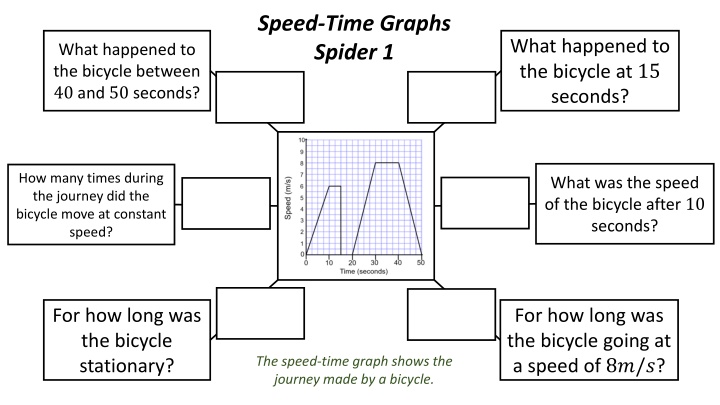
Speed-Time Graphs Spider 1 What happened to the bicycle at 15 seconds? What happened to the bicycle between 40 and 50 seconds? How many times during the journey did the bicycle move at constant speed? What was the speed of the bicycle after 10 seconds? For how long was the bicycle stationary? For how long was the bicycle going at a speed of 8?/?? The speed-time graph shows the journey made by a bicycle.
Speed-Time Graphs Spider 1 - Answers What happened to the bicycle at 15 seconds? What happened to the bicycle between 40 and 50 seconds? It It stopped suddenly decelerated then stopped How many times during the journey did the bicycle move at constant speed? What was the speed of the bicycle after 10 seconds? ??/? ? times For how long was the bicycle stationary? For how long was the bicycle going at a speed of 8?/?? ? seconds ?? seconds The speed-time graph shows the journey made by a bicycle.
Speed-Time Graphs Spider 2 How long did the car take to reach 60?? ? How far did the car travel in total? At what time did the car start to slow down? How long was the car driving at its fastest? What was the greatest speed reached by the car? Between which times did the car accelerate fastest? The speed-time graph shows the journey made by a car.
Speed-Time Graphs Spider 2 - Answers How long did the car take to reach 60?? ? How far did the car travel in total? ??.???? ? minute At what time did the car start to slow down? How long was the car driving at its fastest? ???? ? minutes ???? to ???? ????? What was the greatest speed reached by the car? Between which times did the car accelerate fastest? The speed-time graph shows the journey made by a car.
Speed-Time Graphs Spider 3 How far did the vehicle travel in total? How long did it take the vehicle to reach a speed of 1?/?? Calculate the deceleration of the vehicle until it stopped. For how long was the vehicle travelling at 1.5?/?? What was the acceleration of the toy vehicle at the very start of its journey? Calculate the acceleration between 1 and 2 seconds. The speed-time graph shows the journey made by a toy vehicle.
Speed-Time Graphs Spider 3 - Answers How far did the vehicle travel in total? How long did it take the vehicle to reach a speed of 1?/?? ?.? seconds ?.???? Calculate the deceleration of the vehicle until it stopped. For how long was the vehicle travelling at 1.5?/?? ?.? seconds ??/?? What was the acceleration of the toy vehicle at the very start of its journey? ??/?? ?.??/?? Calculate the acceleration between 1 and 2 seconds. The speed-time graph shows the journey made by a toy vehicle.
Speed-Time Graphs Spider - Answers Type equation here. Type equation here. Type equation here. Type equation here. Type equation here. Type equation here.