Spectral Testing Method Challenges in ADC Coherence
Explore the challenges in spectral testing methods for ADC due to coherency requirements, including the need for high-accuracy signal generators, frequency synthesizers, and the development of new testing approaches. Find out more about coherent sampling, signal generator testing, and the difficulties of maintaining coherency between clock and input signals.

Download Presentation

Please find below an Image/Link to download the presentation.
The content on the website is provided AS IS for your information and personal use only. It may not be sold, licensed, or shared on other websites without obtaining consent from the author. If you encounter any issues during the download, it is possible that the publisher has removed the file from their server.
You are allowed to download the files provided on this website for personal or commercial use, subject to the condition that they are used lawfully. All files are the property of their respective owners.
The content on the website is provided AS IS for your information and personal use only. It may not be sold, licensed, or shared on other websites without obtaining consent from the author.
E N D
Presentation Transcript
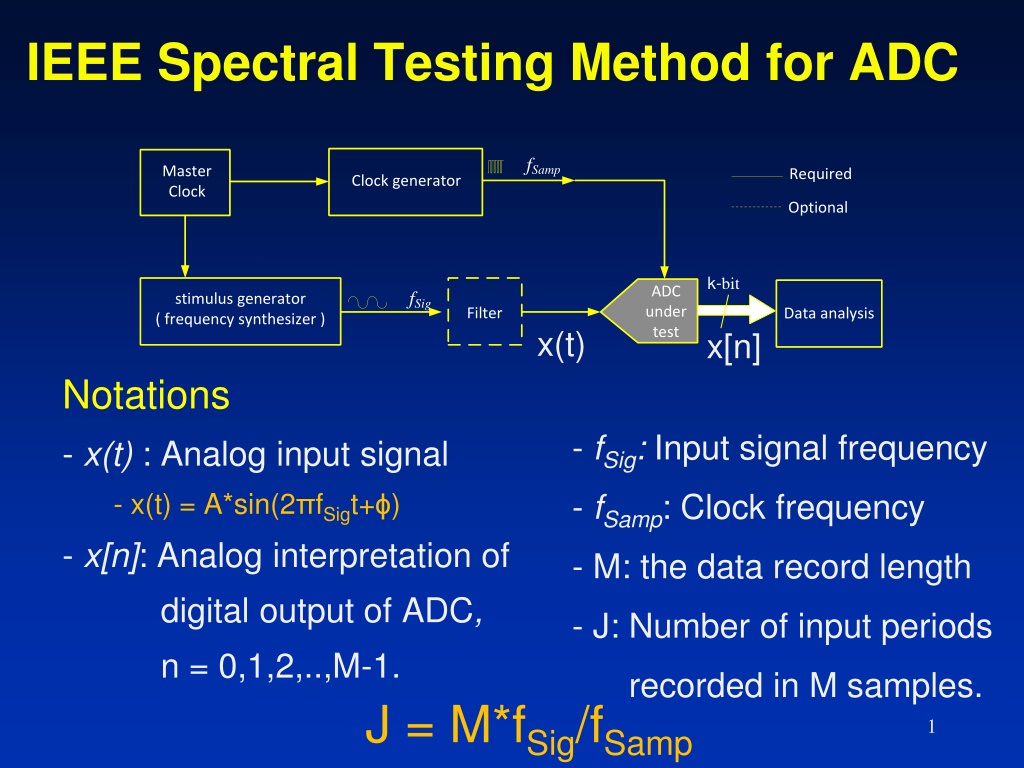
IEEE Spectral Testing Method for ADC fSamp Master Clock Required Clock generator Optional k-bit ADC under test fSig stimulus generator ( frequency synthesizer ) Filter Data analysis x(t) x[n] Notations - x(t) : Analog input signal - x(t) = A*sin(2 fSigt+ ) - x[n]: Analog interpretation of digital output of ADC, n = 0,1,2,..,M-1. - fSig: Input signal frequency - fSamp: Clock frequency - M: the data record length - J: Number of input periods recorded in M samples. J = M*fSig/fSamp 1
Spectral Testing Signal generator Spectral Test fSamp Master Clock Clock generator x(t) k-bit fSig Signal Generator (DUT) Ideal Digitizer Data analysis x[n] Spectral characteristics of the Signal generator is tested Ideal digitizer x[n] harmonic information of the Signal generator 2
IEEE Spectral Testing Method Requirements - Instruments at least 10 times better than DUT - Peak-peak voltage slightly less than ADC input range - Coherent sampling Procedure - Collect M samples (coherently sampled). - Perform DFT. - Compute the spectral parameters Issues J = M*fSig/fSamp is an integer - Challenging to obtain Coherent sampling -- Require highly accurate signal generators -- Require Frequency synthesizers or PLLs 3
Challenges due to coherency In labs, both the clock and input signals are generated from different sources with absolute accuracy. Expensive Not portable If absolute accuracy of both the signal generators is not very high, frequency synthesizers can be used so that both the signals can track each other. Frequency synthesizers are expensive. Maintaining coherency between the input and clock signals to perform on-chip testing is very difficult. There is a need to develop new spectral testing methods that do not require coherency 4
Coherent sampling: exact integral periods in record 1 1 1 0.8 0.8 0.8 0.6 0.6 0.6 0.4 0.4 0.4 0.2 0.2 0.2 0 0 0 -0.2 -0.2 -0.2 -0.4 -0.4 -0.4 -0.6 -0.6 -0.6 -0.8 -0.8 -0.8 -1 -1 -1 0 50 100 150 200 250 0 50 100 150 200 250 300 0 50 100 150 200 250 300 5
Example: f_samp / f_sig = 4096 / 255; 14 bit ADC Best length plus first harnic ID and replacement before DFT Input sine Energy stay in its bins 0 -20 -40 Normalized power spectrum in dB Distortion due to DUT correctly seen -60 -80 -100 -120 0 0.1 0.2 0.3 0.4 0.5 0.6 0.7 0.8 0.9 1 Frequency normalized relative to clock frequency 6
Non-Coherent: fractional periods in record 1 1 1 0.8 0.8 0.8 0.6 0.6 0.6 0.4 0.4 0.4 0.2 0.2 0.2 0 0 0 -0.2 -0.2 -0.2 -0.4 -0.4 -0.4 -0.6 -0.6 -0.6 -0.8 -0.8 -0.8 -1 250 -1 -1 250 0 50 100 150 200 0 50 100 150 200 300 0 50 100 150 200 250 300 7
Coherent: integral J period Non-coherent: J+ period Power in period: /J * P_sig Want this to be less than quantization noise power: P_noise = P_sig/(4^18*3/2) (this is conservative.) /J < 1/(4^18*3/2) =10^(-11) extremely difficult, if not impossible. For 14 bit, 256 times easier 8
IEEE Spectral Testing Effect of Non-coherent Sampling fSig = 374.6948kHz fSig = 374.6954kHz fSamp = 1MHz - Severe spectral leakage (for slight change in fSig) - Inaccurate spectral results A test method that accurately estimates Spectral characteristics even with non-coherently sampled data is required 9
Effect of non-coherent sampling Example: fSamp = 200 MHz M = 8192 Jcoh = 1999 fSig_coh = 48.8037109375 MHz For 1ppm error in fSig fSig = 48.80376 MHz J = 1999.0020096. For 0.5 ppm error in fSig fSig = 48.80373 MHz J = 1999.0007808. 10 Plots show skirting in the spectrum even at 0.5 ppm error level.
Additional graphical illustration 0 0 -10 -20 -20 -40 -30 -40 -60 -50 -80 -60 -70 -100 -80 -120 -90 -100 -140 0 500 1000 1500 2000 2500 3000 3500 4000 4500 0 500 1000 1500 2000 2500 3000 3500 0 0 -10 -10 -20 -20 -30 -30 -40 -40 -50 -50 -60 -60 -70 -70 -80 -80 -90 0 100 200 300 400 500 600 700 0 500 1000 1500 2000 2500 3000 3500 4000 4500 11
Problem Statement fSig and fSamp are not coherent Goal: From x[n] compute the spectral parameters of x(t) accurately. 12
Details on assumptions = + + + sin( = ) y A t + + + 2 3 H ( ) f y ... a y a y a y a y 0 2 3 H H 2 i ( 1, 1, all nonlinearities are lumped into f(y)) a a i 2 + i = ( ) = ( ) x t ( ) V t n t in 1 N ( ( ) 2 k ) x round V t n in 2 i : to find max{ } and accurately Goal a a i 13
Spectral Testing using Traditional FFT Coherent sampling. Compute the FFT of M points 2 kn 1 M j = = ( ) x n e , k = 0,1,2,...,M-1 X M k 0 n Theorem 1: The Fourier coefficient of ith harmonic, Xi*J depends only on the ith harmonic power and noise. 2 2 2 th + = , where is the a harmonic amplitude X a i * i J i i M This method is very efficient and accurate. 14
Spectral Testing using Traditional FFT Non-coherent sampling. Compute the FFT of M points recorded. 2* * * M k n 1 M j = = ( )* x n e , k = 0,1,2,...,M-1 X k 0 n Theorem 2: The error in Xi*J due to non-coherency in the fundamental is large. (Xi*J is the Fourier coefficient of ith harmonic) Theorem 3: The error in Xi*J due to non-coherency in all harmonics (excluding fundamental) is negligible. From Theorems 2 and 3, if the non-coherent fundamental component can be identified and replaced by a coherent fundamental, the harmonic power can be accurately estimated. 15
Existing methods for non-coherency Windowing Most widely used, very fast How it works In time domain: multiply data by a window In freq domain: push skirts down so that leaked power squeezed back into main lobe where the fundamental resides Good for fundamental power, and SFDR Limitations It alters spectrum, wrong SNR, wrong spurs THD may also have significant errors 16
One of the best windows is Blackmann-Harris Problem: it alters spectrum, requires care 21
Existing methods for non-coherency Four parameter sine wave fitting Start with simple estimate of f_sig (from DFT) Use LS on DC, A, f, and , with local linearization of f. Iterate up to six times to get accurate fundamental Use three parameter sine fitting (since f_sig is now known) to estimated each harmonic distortion Limitations If f is not very small, accuracy degrades since orthogonality is violated in LS algorithm THD is right, but SFDR may be wrong if it s from a spur Can adjust #points in data so it contains approximate integer periods, ~orthogonal bases functions in LS Can lead to very slow DFT 24
Existing methods for non-coherency Other techniques for Non-coherency Fundamental ID and Replacement, several variations Single value decomposition, accurate but slow Filter Banks Resampling Issues Speed (some accurate ones are 1000s, or millions times slower than FFT) Accuracy (some only accurate at fundamental, some only accurate at harmonic bins, ) 25
Non-coherent spectral analysis by Resampling Simulation and measurement results with < 50 dB SNR 26
Non-coherent Sampling Many people studied the issue Many papers and patents Bottom line: still need a new method that Computes whole spectrum, not just a few terms Accurate at all spectral bins, Applicable whenever ideal coherent sampling FFT is Computationally efficient, O(M*log(M)) as FFT 29
New approach for noncoherency Directly use captured data with distortion Estimate amplitude, frequency, and phase of base harmonic Replace noncoherent base harmonic with a base harmonic that is coherent with data record length Perform spectral analysis on modified data. 30
Basic premise Harmonic distortion components are much smaller as compared to base harmonic Harmonic distortion components are at frequencies that are different from that of base harmonic, they are orthogonal always true in continuous time not necessarily true in sampled data First harmonic can be identified accurately 31
Procedures: If possible, synchronize the digitizer and input signal by using the upward zero-crossing edge to trigger the start of data collection If this is not possible, as in the case of on-chip applications, Take some extra data points Search for a point that is very close to upward zero- crossing Use this as the start of the data record 32
Procedures: Take sufficient number of samples ADC resolution and target SFDR noise floor SNR and noise floor minimum data record length Mmin From starting point, take 2Mmin samples Search for a suitable data record length M From the start, count the number of upward zero-crossing (not including the start point) After passing Mminpoints, looking for a best zero-crossing that: Is an odd number of zero-crossing Best matches the starting pattern M is the point right before the best zero-crossing 33
Procedures: Identify base harmonic frequency The number of zero-crossing gives the number of integer periods J Use mismatch between the pattern at the start of the selected data record, and the pattern right after M Estimate phase difference The total number of periods of the signal included in the data record length is Jtot = J + /2 Signal frequency is fsig = Jtot/M * fsample Identify signal magnitude Signal power total AC power Identify signal phase Use initial pattern to compute phase 34
Procedures: Replace noncoherent base harmonic with a coherent base harmonic X_n = X_n Asin(2 fsig * n/fsample + phi) + Asin(2 fcoh * n/fsample + phi) = X_n Asin(2 Jtot * n/M + phi) + Asin(2 J * n/M + phi) Alternatively, can just remove the identified base harmonic component, without adding back a coherent one Performance FFT on the modified data Compute THD, SNR, SFDR, SINAD, 35
Algorithm Efficiency Analysis Data acquisition time proportional to data record length: double Computational time Best length search: O(M) First harmonic estimation: <O(1) First harmonic replacement: O(M) FFT: O(M*logM) But this M may be up to 2X original M A little more than 2x standard FFT approach with coherent sampling This is not true. Only true if M=2^K 36
Simulation study Digitizer: 12 ~ 17 bits Data record length: a few thousand Signal frequency: random but < Nyquist Harmonic distortion amount: random Other small random errors included: Signal magnitude Random DC offset Random synchronization error Additive measurement noise 37
Four methods used and compared Ideal: perfect coherent sampling and noise free Standard: DFT assuming periodic signal Best Length: DFT with record length best matching an integer # signal periods Proposed: best length plus first harmonic ID and replacement 38
First example: typical Ideal and Proposed: zero or minimal skirts Best Length: with skirt but accurate SFDR measurements Standard: large skirts and large errors True SFDR computed analytically in continuous time domain 39
data samples from coherent and noncoherent sampling Coherent (o) and noncoherent (*) samples 1.5 1 values of the sampled input 0.5 0 -0.5 -1 -1.5 0 10 20 30 40 50 60 70 80 90 100 time index of the samples 40
Spectrum from ideal coherent sampling With perfectly coherent sampling 0 ADC resolution: 16 Additive measurement noise sigma: 0 LSB DC off-set error: 0.00 LSB -20 Normalized power spectrum in dB -40 Magnitude error: 0.00 percent -60 Coherently sampled SFDR of signal: 102.9 dB True SFDR of signal from model: 103.1 dB -80 -100 -120 0 500 1000 1500 2000 2500 Frequency bins ( 2048 = clock frequency) 41
Standard DFT with noncoherent samples Before any coherency correction 0 ADC resolution: 16 Additive measurement noise sigma: 1 LSB DC off-set error: 7.15 LSB -20 Normalized power spectrum in dB -40 Magnitude error: 0.62 percent -60 Measured SFDR of signal: 54.3 dB True SFDR: 103.1 dB, rms noise: 0.99 LSB -80 -100 -120 0 500 1000 1500 2000 2500 Frequency bins ( 2048 = clock frequency) 42
Best Length with Noncoherent samples After adjusting the data record length 0 ADC resolution: 16 Additive measurement noise sigma: 1 LSB DC off-set error: 7.15 LSB -20 Normalized power spectrum in dB -40 Magnitude error: 0.62 percent -60 Measured SFDR of signal: 100.9 dB True SFDR: 103.1 dB, rms noise: 0.99 LSB -80 -100 -120 0 500 1000 Frequency bins ( 3840 = clock frequency) 1500 2000 2500 3000 3500 4000 43
Proposed: noncoherent samples, best data length, 1st harmonic replacement After coherency correction 0 ADC resolution: 16 Additive measurement noise sigma: 1 LSB DC off-set error: 7.15 LSB -20 Normalized power spectrum in dB -40 Magnitude error: 0.62 percent -60 Measured SFDR of signal: 103.0 dB True SFDR: 103.1 dB, rms noise: 0.99 LSB -80 -100 -120 0 500 1000 Frequency bins ( 3840 = clock frequency) 1500 2000 2500 3000 3500 4000 44
Second example Atypical, but with non-negligible probability Standard and Best Length: Large skirts visible Fail to produce correct SFDR results Proposed and Ideal: Still has non-zero or minimal skirt Still achieves accurate SFDR testing 45
data samples from coherent and noncoherent sampling Coherent (o) and noncoherent (*) samples 1 values of the sampled input 0.5 0 -0.5 -1 0 10 20 30 40 50 60 70 80 90 100 time index of the samples 46
Spectrum from ideal coherent sampling With perfectly coherent sampling 0 ADC resolution: 15 Additive measurement noise sigma: 0 LSB DC off-set error: 0.00 LSB -20 Normalized power spectrum in dB -40 Magnitude error: 0.00 percent -60 Coherently sampled SFDR of signal: 97.5 dB True SFDR of signal from model: 97.1 dB -80 -100 -120 0 500 1000 1500 2000 2500 Frequency bins ( 2048 = clock frequency) 47
Standard DFT method with noncoherent data samples Before any coherency correction 0 ADC resolution: 15 Additive measurement noise sigma: 1 LSB DC off-set error: -18.33 LSB -20 Normalized power spectrum in dB -40 Magnitude error: -0.16 percent -60 Measured SFDR of signal: 41.6 dB True SFDR: 97.1 dB, rms noise: 0.97 LSB -80 -100 -120 0 500 1000 1500 2000 2500 Frequency bins ( 2048 = clock frequency) 48
Noncoherent samples with best data record length After adjusting the data record length 0 ADC resolution: 15 Additive measurement noise sigma: 1 LSB DC off-set error: -18.33 LSB -20 Normalized power spectrum in dB -40 Magnitude error: -0.16 percent -60 Measured SFDR of signal: 77.3 dB True SFDR: 97.1 dB, rms noise: 0.97 LSB -80 -100 -120 0 500 1000 1500 2000 2500 Frequency bins ( 2050 = clock frequency) 49
The proposed method: noncoherent samples, best data length, 1st harmonic replacement After coherency correction 0 ADC resolution: 15 Additive measurement noise sigma: 1 LSB DC off-set error: -18.33 LSB -20 Normalized power spectrum in dB -40 Magnitude error: -0.16 percent -60 Measured SFDR of signal: 96.9 dB True SFDR: 97.1 dB, rms noise: 0.97 LSB -80 -100 -120 0 500 1000 1500 2000 2500 Frequency bins ( 2050 = clock frequency) 50


