Similarity Learning


Similarity Learning
in
Financial Services
Dhagash Mehta
BlackRock, Inc.
D
i
s
c
l
a
i
m
e
r
:
T
h
e
v
i
e
w
s
e
x
p
r
e
s
s
e
s
h
e
r
e
a
r
e
t
h
o
s
e
o
f
t
h
e
a
u
t
h
o
r
s
a
l
o
n
e
a
n
d
n
o
t
o
f
B
l
a
c
k
R
o
c
k
,
I
n
c
.
Introduction: Similarity
Scene from Alice’s Adventures in Wonderland by Lewis Carroll, 1865. Artist: John Tenniel
In the picture from left to right: Alice, March Hare and Mad Hatter.
Source: https://www.theguardian.com/global/2015/dec/29/weekly-notes-queries-carroll-raven-desk
Why is a raven like a
writing desk?
Some answers from the web…
•
Because [Edgar Allen] Poe wrote on both.
•
Because outstanding bills are found on both of them.
•
Because a writing desk is a rest for pens and a raven is a pest for wrens [type of small
birds].
•
Because it can produce a few notes, tho they are very flat; and it is nevar put with the
wrong end in front! –
Lewis Carroll
’s answer after the book was published. He also wrote
the spelling of ‘never’ as ‘nevar’ which is ‘raven’ spelled backwards.
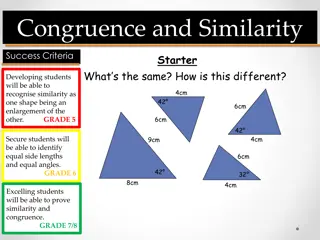
Introduction: Similarity as Cognitive Intelligence
•
Recognizing similarities between two objects is one of the fundamental cognition
abilities for the human as well as for many other living organisms.
•
An important survival skill (e.g., comparing new objects with the previously known
ones to guess if the new ones will be safer or dangerous)
Similarity in art
:
“The Mona Lisa “1503-1517 painting by Italian painter Leonardo da Vinci
; a
nd “Self-Portrait with Monkey
“1938, by Mexican painter Frida Kahlo.
Source:
https://morrisschooldistrict.instructure.com/courses/2315/assignments/123274
Similarity: (Vague) Problem Formulation
More concretely,
•
Question 1
: Given an object/product, what are other similar objects/products?
•
Question 2
: How similar are the given two objects/products? (Or, different from each
other?)
•
A very frequently arising problem in most business areas.
Similarity: Applications across industries
•
Amazon recommending similar items to what you search
•
Netflix recommendation of similar movies to what you watched
•
Zillow’s Zestimate of house price based on similar houses
•
Spotify’s song/podcast/artist recommendation
•
Face recognition on Facebook or screen-lock on cell-phones
•
Semantic similarity (e.g., similar words, e.g., Google’s dictionary help)
•
Facebook’s friend recommendation
Etc.
Similarity: Applications in Financial Services
•
Many applications in finance, most already well appreciated:
- Illiquid asset similarity (trading a more liquid substitute, e.g., corp bonds)
- Mutual fund/ETF similarity (portfolio diversification, alternative portfolio
construction, sales and marketing, tax loss harvesting, etc.)
- Algorithmic trading, relative values
etc.
•
Most, if not all, still rely on correlations.
•
Going beyond correlations has been tricky due to noisy datasets
•
Similarity measures extrapolated from traditional methods (e.g., unsupervised
clustering) may often fail for problems which require global, local and dynamic
measure of similarity (e.g. portfolio construction and trading problems)
Similarity: Applications in Financial Services
•
In this talk, we focus on identifying
similarity between corporate bonds
.
•
The corporate bond market is diverse, securities are traded in varying volume and
frequencies. Having a similarity measure can help with use cases such as:
-
identifying “liquid substitutes” in trading and investment processes to help efficiently source
liquidity and significantly improve fill rates, as well as transaction costs, while reducing the
negotiation cycles between traders and portfolio managers
-
finding more-accurate pricing for illiquid securities where there may be little to no observable
data on target, but we can infer price movements based on similar securities
- Replacing heuristics-based sector categories broadly used in portfolio management and risk
factors with more-dynamic, data-driven cohorts of similar instruments
[Madhavan, Pasquali &
Sommer 2022]
•
PS: For the rest of the talk, we focus on the methodology rather than the end
applications.
Similarity: (Slightly) More Precise Problem Formulation
In practice, a similarity problem may arise in different paradigms. (In the recommender
systems, it is categorized as ‘case-based recommender system’)
•
Similarity between objects with respect to static data
•
Similarity between objects with respect to time-series data
•
Similarity between objects using users’ feedback for the objects
Mathematically, what is
similarity
?
•
Imagine we have 'n' number of variables such as
•
Then, a bond is a point in this n-dimensional space
•
Two bonds are similar if the corresponding two points in the n-dimensional
space are 'close'
•
What is 'close' in terms of math? Answer: the distance between the two points is
small
•
What is 'distance' in terms of math? Answer: the Euclidean distance
or, is it the only option?
Similarity: Rigorous Definition
Euclidean distance isn’t always the right choice…
Similarity: Rigorous Definition
•
For a given dataset, which of these distance metric should we pick?
•
Most of the academic literature on similarities in finance and economics has been implicitly
or explicitly focused on the Euclidean distance.
•
The importance of a correct distance metric for the given dataset or problem is much more
appreciated in many other quantitative areas (Physics for one) than finance and economics,
generally speaking.
Proposed Idea
:
•
In this work, instead of choosing a specific distance metric ourselves, we propose to
learn
it
from the data
•
In machine learning, learning a distance metric from data is called '
distance metric learning
',
or sometimes simply
'metric learning
'.
Similarity: Rigorous Definition
•
There are various methods to learn the distance metric from the data:
1.
Trial-and-error:
•
Treat the 'distance metric' of an algorithm as a
hyperparameter
, and tune it
(Euclidean, Chebyshev, Manhattan, p-Minkowski, etc.) with respect to a chosen
metric.
2.
Supervised Distance Metric Learning:
•
Assume that labels for similarity between all the pairs of data, or classes for each
data-point exist,
•
Work backwards to identify the distance metric which would have made these labels
possible.
Similarity: Distance Metric Learning
•
There are various methods to learn the distance metric from the data:
1.
Trial-and-error:
•
Treat the 'distance metric' of an algorithm as a
hyperparameter
, and tune it
(Euclidean, Chebyshev, Manhattan, p-Minkowski, etc.) with respect to a chosen
metric.
2.
Supervised Distance Metric Learning:
•
Assume that labels for similarity between all the pairs of data, or classes for each
data-point exist,
•
Work backwards to identify the distance metric which would have made these labels
possible.
Similarity: Distance Metric Learning
Previous examples revisited: Distance Metric Learning
-
Keep obtaining labels (‘Close’/‘Far’) for each pair of places (of Manhattan) or cities
(on the Earth)
-
Based on these labels, reverse engineer the distance metric that would have made
these labels possible.
-
In practice, this problem can be posed as a machine learning problem.
Traditional Distance Metric Learning
•
Question
: How can we get the ‘Close’/’Far’ labels for financial assets?!
•
Answer
: Can be many ways to obtain labels, e.g.,
1.
Morningstar/Lipper categories (Desai&Mehta 2021):
If two funds are in the same category = ‘Close’
If two funds are in different categories = ‘Far’
2.
For corporate bonds, for example:
If |YTM
i
– YTM
j
| < 10
-4
= ‘Close’
Otherwise,
= ‘Far’
etc.
•
Choice of labels brings a specific ‘definition’ of similarity with it.
Traditional Distance Metric Learning
Classical distance metric learning (Xing et al. 2002):
Solve the following convex optimization problem:
Minimize the distance
between data points
labeled as ‘similar’.
Distance between
‘dissimilar’ data points
should be large.
The constraint that A should
be positive definite.
Solving this optimization problem will give us the final A, and we are done.
•
Start with a parametric (family of) distance
metrics.
•
E.g., the Manalanobis distance metric:
PC Mahalanobis (1893-1972)
Traditional Distance Metric Learning
The limitations of the traditional DML and its variants are:
-
The variables are supposed to be
numerical
(as opposed to
categorical
) variables.
Categorical variables may cause problems.
-
Preprocessing of data
is needed, e.g., rescaling the data to bring them between [0,1], for
example;
-
Missing values
may cause problems;
-
Not scalable to large datasets
and needs reduced dimension (e.g., with PCA) if there are
many variables;
-
Increases the dataset
size by N-choose-2 as it needs pair-wise labels. N = no of data-points.
-
Learns
global
distance metric, not necessarily a
local
distance metric.
Limitations of Traditional Distance Metric Learning
Euclidean
Nonlinear Distance
Metrics
Distance Metric Learning using Tree-based Methods
•
Novel two-step idea (Breiman&Cutler2002; Jeyapaulraj, Desai, Chu, Mehta, Pasqual and
Sommer, 2022):
Step-1
: Train a tree-based method (e.g., Decision Tree, Random Forest, Gradient Boosting
Machines, etc.).
Input variables: Chosen input variables (e.g., bond attributes)
Target variable: Chosen labels (e.g., bond yield)
Step-2
: Compute the similarity from the trees based whether a pair of data-points fall in the
same leaf node.
P1, P2
P4
P1 and P2 are similar
P1 and P3 are dissimilar
P1 and P4 are dissimilar
P2 and P3 are dissimilar
P2 and P4 are dissimilar
P3
Distance Metric Learning using Tree-based Methods
•
Why should a decision tree (or in general tree-based methods) be viewed as a distance
metric learning method?!
•
Random Forest is an adaptive nearest neighbors method [Lin&Jeon2004]!
Distance Metric Learning using Tree-based Methods
•
For multiple trees, one can compute aggregate similarity.
•
E.g., for Random Forest, the similarity between two data-points is the number of times
two data-points fall in the same leaf nodes.
The framework overcomes limitations of the previous methodology, and carries forward
the advantages of the tree-based methods:
-
The variables can be numerical and categorical.
-
Minimal preprocessing of variables is needed, e.g., no rescaling of the data needed;
-
Missing values can be taken care of by tree-based methods;
-
Scalable to much large datasets;
-
No need to do dimensional reduction even if there are many variables;
-
No need for pair-wise labels, and hence no increase in the size of dataset.
-
Learns local distance metric due to different partitioning in different regions in the
space.
-
Tree-based methods are at a sweet spot between simplistic (linear) and interpretable
models and complex but black-box models.
Advantages of Distance Metric Learning using Tree-based Methods
Data Description
•
Samples: ~10K (Subset of global corporate bonds, U.S. only)
•
Target: Yield to Maturity (YTM) (for the purpose of this talk)
•
Cross-sectional features: Coupon, Coupon Frequency, Duration, Country, Days to
Maturity, Age, Industry, Amount Issues, Amount Outstanding, Bond Rating, etc.
•
Evaluation metric: RMSE (and MAPE)
•
Goal: Identify bonds which are similar in terms of above mentioned features and target.
In this case the target variable is related to liquidity.
[Sommer & Pasquali 2016]
•
Split/Validation: 90-10 Train-Test split; 5 Fold CV
Data Description: Random Forest Based Similarity for Corporate Bonds
Results: Random Forest Based Similarity for Corporate Bonds
Train Random Forest on the given data.
Evaluation: Random Forest Based Similarity for Corporate Bonds
k-NN RMSE error compared to Random Forest
•
We ran k-NN algorithm on 4 different
set of distance metrics:
1.
Euclidean distance
2.
Gower distance
3.
Proximity
4.
OOB Proximity
•
We compute neighbors based on
weighted distance (neighbors which
are closer will get more weights to
decide the class)
Conclusions
•
Similarity learning is one of the most interesting areas in machine learning, with many
applications in financial services.
•
Using correct distance metric for the given data is crucial to compute similarity among
data-points correctly.
•
Supervised similarity learning is a more rigorous way to define and learn similarity
rather than unsupervised (e.g., clustering with arbitrary distance metric).
•
In this work, we have proposed using tree-based methodology to learn distance
metric.
References
Financial Asset Similarity
•
Dhagash Mehta, Dhruv Desai, and Jithin Pradeep. "
Machine learning fund categorizations.
" In
Proceedings of the First ACM
International Conference on AI in Finance
, pp. 1-8. 2020.
•
Vipul Satone, Dhruv Desai, and Dhagash Mehta. "
Fund2Vec: mutual funds similarity using graph learning.
" In
Proceedings of the
Second ACM International Conference on AI in Finance
, pp. 1-8. 2021.
•
Dhruv Desai, and Dhagash Mehta. "
On Robustness of Mutual Funds Categorization and Distance Metric Learning.
"
The Journal of
Financial Data Science
3, no. 4 (2021): 130-150.
•
*Jerinsh Jeyapaulraj, Dhruv Desai, Peter Chu, Dhagash Mehta, Stefano Pasquali, and Philip Sommer. "
Supervised similarity
learning for corporate bonds using Random Forest proximities.
"
arXiv preprint arXiv:2207.04368
(2022). Accepted for
Proceedings
of the Third ACM International Conference on AI in Finance
. 2022.
•
Dimitrios Vamvourellis, Mate Attila Toth, Dhruv Desai, Dhagash Mehta, and Stefano Pasquali. "
Learning Mutual Fund
Categorization using Natural Language Processing
."
arXiv preprint arXiv:2207.04959
(2022). Accepted for
Proceedings of the Third
ACM International Conference on AI in Finance
. 2022.
Investor Similarity
•
Han-Tai Shiao, Cynthia Pagliaro, Dhagash Mehta.
Using Machine Learning to Model Advised-Investor Behavior
. The Journal of
Financial Data Science 4 (4), 25-38. 2022.
•
Fu Tan, Dhagash Mehta. Health State Risk Categorization:
A Machine Learning Clustering Approach Using Health and Retirement
Study Data.
4 (2), 139-167. 2022.
•
Cynthia Pagliaro, Dhagash Mehta, Han-Tai Shiao, Shaofei Wang, Luwei Xiong.
Investor Modeling by analyzing financial advisor
notes: a machine learning perspective.
Proceedings of the Second ACM International Conference on AI in Finance, 1-8. 2021.
•
Thomas de Luca and Dhagash Mehta.
ESG fund usage among investor households: A machine learning based behavioral study.
Accepted for publication in Journal of ESG and Impact Investing.
Exploring the concept of similarity learning in financial services, this text delves into its applications and significance across industries. Highlighting key areas such as illiquid asset similarity and mutual fund comparison, it emphasizes the role of cognitive intelligence in recognizing similarities for informed decision-making.

Download Presentation

Please find below an Image/Link to download the presentation.
The content on the website is provided AS IS for your information and personal use only. It may not be sold, licensed, or shared on other websites without obtaining consent from the author.If you encounter any issues during the download, it is possible that the publisher has removed the file from their server.
You are allowed to download the files provided on this website for personal or commercial use, subject to the condition that they are used lawfully. All files are the property of their respective owners.
The content on the website is provided AS IS for your information and personal use only. It may not be sold, licensed, or shared on other websites without obtaining consent from the author.
E N D
Presentation Transcript
Similarity Learning in Financial Services Dhagash Mehta BlackRock, Inc. Disclaimer: The views expresses here are those of the authors alone and not of BlackRock, Inc. Disclaimer: The views expresses here are those of the authors alone and not of BlackRock, Inc. 1
Introduction: Similarity Some answers from the web Because [Edgar Allen] Poe wrote on both. Because outstanding bills are found on both of them. Because a writing desk is a rest for pens and a raven is a pest for wrens [type of small birds]. Because it can produce a few notes, tho they are very flat; and it is nevar put with the wrong end in front! Lewis Carroll s answer after the book was published. He also wrote the spelling of never as nevar which is raven spelled backwards. Why is a raven like a writing desk? Scene from Alice s Adventures in Wonderland by Lewis Carroll, 1865. Artist: John Tenniel In the picture from left to right: Alice, March Hare and Mad Hatter. Source: https://www.theguardian.com/global/2015/dec/29/weekly-notes-queries-carroll-raven-desk 2
Introduction: Similarity as Cognitive Intelligence Recognizing similarities between two objects is one of the fundamental cognition abilities for the human as well as for many other living organisms. An important survival skill (e.g., comparing new objects with the previously known ones to guess if the new ones will be safer or dangerous) Similarity in art: The Mona Lisa 1503-1517 painting by Italian painter Leonardo da Vinci; and Self-Portrait with Monkey 1938, by Mexican painter Frida Kahlo. Source: https://morrisschooldistrict.instructure.com/courses/2315/assignments/123274 3
Similarity: (Vague) Problem Formulation More concretely, Question 1: Given an object/product, what are other similar objects/products? Question 2: How similar are the given two objects/products? (Or, different from each other?) A very frequently arising problem in most business areas. 4
Similarity: Applications across industries Amazon recommending similar items to what you search Netflix recommendation of similar movies to what you watched Zillow s Zestimate of house price based on similar houses Spotify s song/podcast/artist recommendation Face recognition on Facebook or screen-lock on cell-phones Semantic similarity (e.g., similar words, e.g., Google s dictionary help) Facebook s friend recommendation Etc. 5
Similarity: Applications in Financial Services Many applications in finance, most already well appreciated: - Illiquid asset similarity (trading a more liquid substitute, e.g., corp bonds) - Mutual fund/ETF similarity (portfolio diversification, alternative portfolio construction, sales and marketing, tax loss harvesting, etc.) - Algorithmic trading, relative values etc. Most, if not all, still rely on correlations. Going beyond correlations has been tricky due to noisy datasets Similarity measures extrapolated from traditional methods (e.g., unsupervised clustering) may often fail for problems which require global, local and dynamic measure of similarity (e.g. portfolio construction and trading problems) 6
Similarity: Applications in Financial Services In this talk, we focus on identifying similarity between corporate bonds. The corporate bond market is diverse, securities are traded in varying volume and frequencies. Having a similarity measure can help with use cases such as: - identifying liquidsubstitutes in trading and investment processes to help efficiently source liquidity and significantly improve fill rates, as well as transaction costs, while reducing the negotiation cycles between traders and portfolio managers - finding more-accurate pricing for illiquid securities where there may be little to no observable data on target, but we can infer price movements based on similar securities - Replacing heuristics-based sector categories broadly used in portfolio management and risk factors with more-dynamic, data-driven cohorts of similar instruments [Madhavan, Pasquali & Sommer 2022] PS: For the rest of the talk, we focus on the methodology rather than the end applications. 7
Similarity: (Slightly) More Precise Problem Formulation In practice, a similarity problem may arise in different paradigms. (In the recommender systems, it is categorized as case-based recommender system ) Similarity between objects with respect to static data Similarity between objects with respect to time-series data Similarity between objects using users feedback for the objects 8
Similarity: Rigorous Definition Mathematically, what is similarity? Imagine we have 'n' number of variables such as Then, a bond is a point in this n-dimensional space Two bonds are similar if the corresponding two points in the n-dimensional space are 'close' What is 'close' in terms of math? Answer: the distance between the two points is small What is 'distance' in terms of math? Answer: the Euclidean distance or, is it the only option? 9
Similarity: Rigorous Definition Euclidean distance isn t always the right choice 10
Similarity: Rigorous Definition For a given dataset, which of these distance metric should we pick? Most of the academic literature on similarities in finance and economics has been implicitly or explicitly focused on the Euclidean distance. The importance of a correct distance metric for the given dataset or problem is much more appreciated in many other quantitative areas (Physics for one) than finance and economics, generally speaking. Proposed Idea: In this work, instead of choosing a specific distance metric ourselves, we propose to learn it from the data In machine learning, learning a distance metric from data is called 'distance metric learning', or sometimes simply 'metric learning'. 11
Similarity: Distance Metric Learning There are various methods to learn the distance metric from the data: 1. Trial-and-error: Treat the 'distance metric' of an algorithm as a hyperparameter, and tune it (Euclidean, Chebyshev, Manhattan, p-Minkowski, etc.) with respect to a chosen metric. 2. Supervised Distance Metric Learning: Assume that labels for similarity between all the pairs of data, or classes for each data-point exist, Work backwards to identify the distance metric which would have made these labels possible. 12
Similarity: Distance Metric Learning There are various methods to learn the distance metric from the data: 1. Trial-and-error: Treat the 'distance metric' of an algorithm as a hyperparameter, and tune it (Euclidean, Chebyshev, Manhattan, p-Minkowski, etc.) with respect to a chosen metric. 2. Supervised Distance Metric Learning: Assume that labels for similarity between all the pairs of data, or classes for each data-point exist, Work backwards to identify the distance metric which would have made these labels possible. 13
Traditional Distance Metric Learning Previous examples revisited: Distance Metric Learning - Keep obtaining labels ( Close / Far ) for each pair of places (of Manhattan) or cities (on the Earth) - Based on these labels, reverse engineer the distance metric that would have made these labels possible. - In practice, this problem can be posed as a machine learning problem. 14
Traditional Distance Metric Learning Question: How can we get the Close / Far labels for financial assets?! Answer: Can be many ways to obtain labels, e.g., 1. Morningstar/Lipper categories (Desai&Mehta 2021): If two funds are in the same category = Close If two funds are in different categories = Far 2. For corporate bonds, for example: If |YTMi YTMj| < 10-4= Close Otherwise, = Far etc. Choice of labels brings a specific definition of similarity with it. 15
Traditional Distance Metric Learning Classical distance metric learning (Xing et al. 2002): Start with a parametric (family of) distance metrics. E.g., the Manalanobis distance metric: Solve the following convex optimization problem: PC Mahalanobis (1893-1972) Distance between dissimilar data points should be large. Minimize the distance between data points labeled as similar . The constraint that A should be positive definite. Solving this optimization problem will give us the final A, and we are done. 16
Limitations of Traditional Distance Metric Learning The limitations of the traditional DML and its variants are: - The variables are supposed to be numerical (as opposed to categorical) variables. Categorical variables may cause problems. - Preprocessing of data is needed, e.g., rescaling the data to bring them between [0,1], for example; - Missing values may cause problems; - Not scalable to large datasets and needs reduced dimension (e.g., with PCA) if there are many variables; - Increases the dataset size by N-choose-2 as it needs pair-wise labels. N = no of data-points. - Learns global distance metric, not necessarily a local distance metric. Euclidean Nonlinear Distance Metrics 17
Distance Metric Learning using Tree-based Methods Novel two-step idea (Breiman&Cutler2002; Jeyapaulraj, Desai, Chu, Mehta, Pasqual and Sommer, 2022): Step-1: Train a tree-based method (e.g., Decision Tree, Random Forest, Gradient Boosting Machines, etc.). Input variables: Chosen input variables (e.g., bond attributes) Target variable: Chosen labels (e.g., bond yield) Step-2: Compute the similarity from the trees based whether a pair of data-points fall in the same leaf node. P1 and P2 are similar P1 and P3 are dissimilar P1 and P4 are dissimilar P2 and P3 are dissimilar P2 and P4 are dissimilar P4 P3 18 P1, P2
Distance Metric Learning using Tree-based Methods Why should a decision tree (or in general tree-based methods) be viewed as a distance metric learning method?! Random Forest is an adaptive nearest neighbors method [Lin&Jeon2004]! 19
Distance Metric Learning using Tree-based Methods For multiple trees, one can compute aggregate similarity. E.g., for Random Forest, the similarity between two data-points is the number of times two data-points fall in the same leaf nodes. Similarity (P1,P2) = ?+?+? = 0.33 ? Similarity (P3,P4) = ?+?+? = 1 ? P1 P3, P4 P2 P1 P2 P3, P4 P3, P4 P1,P2 20
Advantages of Distance Metric Learning using Tree-based Methods The framework overcomes limitations of the previous methodology, and carries forward the advantages of the tree-based methods: - The variables can be numerical and categorical. - Minimal preprocessing of variables is needed, e.g., no rescaling of the data needed; - Missing values can be taken care of by tree-based methods; - Scalable to much large datasets; - No need to do dimensional reduction even if there are many variables; - No need for pair-wise labels, and hence no increase in the size of dataset. - Learns local distance metric due to different partitioning in different regions in the space. - Tree-based methods are at a sweet spot between simplistic (linear) and interpretable models and complex but black-box models. 21
Data Description: Random Forest Based Similarity for Corporate Bonds Data Description Samples: ~10K (Subset of global corporate bonds, U.S. only) Target: Yield to Maturity (YTM) (for the purpose of this talk) Cross-sectional features: Coupon, Coupon Frequency, Duration, Country, Days to Maturity, Age, Industry, Amount Issues, Amount Outstanding, Bond Rating, etc. Evaluation metric: RMSE (and MAPE) Goal: Identify bonds which are similar in terms of above mentioned features and target. In this case the target variable is related to liquidity. [Sommer & Pasquali 2016] Split/Validation: 90-10 Train-Test split; 5 Fold CV 22
Results: Random Forest Based Similarity for Corporate Bonds Train Random Forest on the given data. Split RMSE MAPE Train (5-Fold CV) 0.21 0.08 Test 0.51 0.15 23
Evaluation: Random Forest Based Similarity for Corporate Bonds We ran k-NN algorithm on 4 different set of distance metrics: 1. Euclidean distance 2. Gower distance 3. Proximity 4. OOB Proximity We compute neighbors based on weighted distance (neighbors which are closer will get more weights to decide the class) k-NN RMSE error compared to Random Forest 24
Conclusions Similarity learning is one of the most interesting areas in machine learning, with many applications in financial services. Using correct distance metric for the given data is crucial to compute similarity among data-points correctly. Supervised similarity learning is a more rigorous way to define and learn similarity rather than unsupervised (e.g., clustering with arbitrary distance metric). In this work, we have proposed using tree-based methodology to learn distance metric. 25
References Financial Asset Similarity Dhagash Mehta, Dhruv Desai, and Jithin Pradeep. "Machine learning fund categorizations." In Proceedings of the First ACM International Conference on AI in Finance, pp. 1-8. 2020. Vipul Satone, Dhruv Desai, and Dhagash Mehta. "Fund2Vec: mutual funds similarity using graph learning." In Proceedings of the Second ACM International Conference on AI in Finance, pp. 1-8. 2021. Dhruv Desai, and Dhagash Mehta. "On Robustness of Mutual Funds Categorization and Distance Metric Learning." The Journal of Financial Data Science 3, no. 4 (2021): 130-150. *Jerinsh Jeyapaulraj, Dhruv Desai, Peter Chu, Dhagash Mehta, Stefano Pasquali, and Philip Sommer. "Supervised similarity learning for corporate bonds using Random Forest proximities." arXiv preprint arXiv:2207.04368 (2022). Accepted for Proceedings of the Third ACM International Conference on AI in Finance. 2022. Dimitrios Vamvourellis, Mate Attila Toth, Dhruv Desai, Dhagash Mehta, and Stefano Pasquali. "Learning Mutual Fund Categorization using Natural Language Processing." arXiv preprint arXiv:2207.04959 (2022). Accepted for Proceedings of the Third ACM International Conference on AI in Finance. 2022. Investor Similarity Han-Tai Shiao, Cynthia Pagliaro, Dhagash Mehta. Using Machine Learning to Model Advised-Investor Behavior. The Journal of Financial Data Science 4 (4), 25-38. 2022. Fu Tan, Dhagash Mehta. Health State Risk Categorization: A Machine Learning Clustering Approach Using Health and Retirement Study Data. 4 (2), 139-167. 2022. Cynthia Pagliaro, Dhagash Mehta, Han-Tai Shiao, Shaofei Wang, Luwei Xiong. Investor Modeling by analyzing financial advisor notes: a machine learning perspective. Proceedings of the Second ACM International Conference on AI in Finance, 1-8. 2021. Thomas de Luca and Dhagash Mehta. ESG fund usage among investor households: A machine learning based behavioral study. Accepted for publication in Journal of ESG and Impact Investing. 26


 Problem Formulation")


 More Precise Problem Formulation")