Science Starters for Motion Maps and Buggy Lab Agenda
Explore the world of motion maps and delve into the concepts of velocity and direction with engaging activities such as the Buggy Lab. Discover how to interpret motion maps and analyze different types of motion patterns. Enhance your understanding of physics with hands-on experiments and interactive learning materials.
Download Presentation

Please find below an Image/Link to download the presentation.
The content on the website is provided AS IS for your information and personal use only. It may not be sold, licensed, or shared on other websites without obtaining consent from the author.If you encounter any issues during the download, it is possible that the publisher has removed the file from their server.
You are allowed to download the files provided on this website for personal or commercial use, subject to the condition that they are used lawfully. All files are the property of their respective owners.
The content on the website is provided AS IS for your information and personal use only. It may not be sold, licensed, or shared on other websites without obtaining consent from the author.
E N D
Presentation Transcript
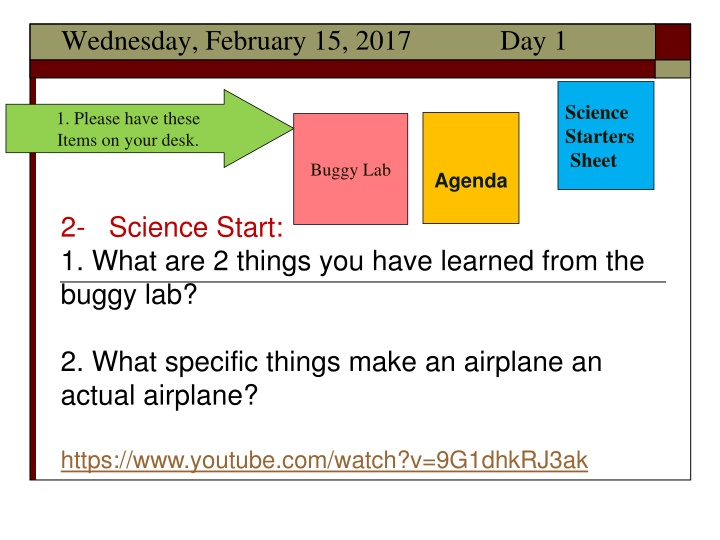
Wednesday, February 15, 2017 Day 1 Science Starters Sheet 1. Please have these Items on your desk. Buggy Lab Agenda 2- Science Start: 1. What are 2 things you have learned from the buggy lab? 2. What specific things make an airplane an actual airplane? https://www.youtube.com/watch?v=9G1dhkRJ3ak
Table of Contents Update 2/15(Purple) Motion Map Notes Page 28 2/15(Blue) Buggy Lab Page 29
White board the buggy lab . . . . On the board you should have: 1. One line of best fit graph. 2. Explain your graph. What is it showing? 3. What is your evidence?
Motion Map Parts The dot: Indicates the position of the object The arrow: indicates the direction and speed of the object. (sometimes called a vector)
Dots and Arrows Together Dot alone = not moving. Dot and arrow together: Position, direction and speed.
Direction and Size Right = positive direction The longer the arrow, the greater the velocity. SLOW FASTER Left = negative direction FASTEST
The grid. Motion Maps are drawn along a grid to show the position of the object. Draw a minimum of 3 arrows to show a pattern. Forward, Constant Velocity, Slow Forward, Constant Velocity, Faster
More Complicated Motion The object moves forward at constant velocity, then stops and remains in place for two seconds, then moves backward at a slower constant velocity.
Example 1 The car is accelerating! Each successive arrow is longer, indicating the velocity is increasing. Draw a motion map.
Example 2 The car is accelerating! The car is NOT moving. The car is moving at constant velocity! Each successive arrow is SMALLER, indicating the velocity is decreasing over time. changing. A dot indicates time is passing, but no arrow means no velocity. The arrows are all the same size, this indicates that the velocity is NOT
