Sampling Procedures for Finite Populations
Sampling from finite populations involves considerations such as population size, sample size, and when normal-based procedures can be applied. This review covers key concepts like using binomial procedures, normal approximation, and the impact of sample size on accuracy. Additionally, it discusses specific investigations and interpretations related to sampling methods in statistical analysis.

Download Presentation

Please find below an Image/Link to download the presentation.
The content on the website is provided AS IS for your information and personal use only. It may not be sold, licensed, or shared on other websites without obtaining consent from the author.If you encounter any issues during the download, it is possible that the publisher has removed the file from their server.
You are allowed to download the files provided on this website for personal or commercial use, subject to the condition that they are used lawfully. All files are the property of their respective owners.
The content on the website is provided AS IS for your information and personal use only. It may not be sold, licensed, or shared on other websites without obtaining consent from the author.
E N D
Presentation Transcript
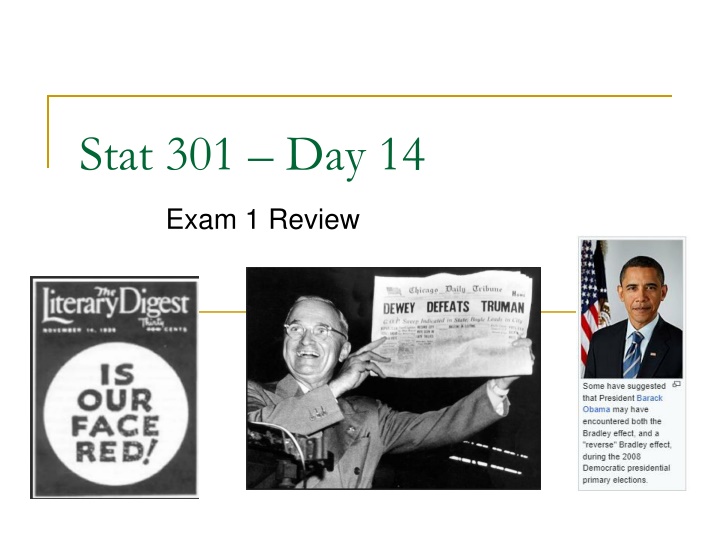
Stat 301 Day 14 Exam 1 Review
Announcements Office hour 2:30-3:30 today Additional office hour tonight on zoom 8pm? Discussion Board questions Will continue to monitor, please feel free to ask follow-up questions ( vs. go over vs. but here ) Bring calculator, one page of notes tomorrow HW 4 posted soon
Recap: Sampling from finite population When sampling from a finite population, if the population is large compared to the sample size, can use the same binomial procedures Population N > 20 n In which case, exact size of population and fraction sampled don t matter! (tasting soup) And if the sample size is large, can use the same normal-based procedures At least 10 (expected) successes and 10 (expected) failures
Recap: Population size doesnt matter!!! n = 10
Recap Simulation of the random process (e.g., coin tossing, spinners) Binomial: exact probability distribution z-procedures: normal approximation to the binomial (CLT) Need large sample size Does come with formulas, e.g., ? = ?01 ?0 ? Helps with what if questions ? ?0
Investigation 1.14 Ok to use z-procedures because population of US teens is much larger than 1771 (> 20 x 1771) (so SD formula works without FPCF) 1771 is a large sample size (1771 x 0.20 = 354.2 > 10) Continuity correction?
Investigation 1.14 Two-sided p-value = .2079 Interpretation: 20.8% of random samples of 1,771 teens from this population would have ? .118 ?? ? .282 if 20% of all teens had some level of hearing loss Evaluation: The p-value is not small (e.g., .2079 > 0.05). Conclusion: We do not have convincing evidence against = 0.20 and in favor of 0.20 because our p-value is not small. It is plausible that 20% of US teens have some level of hearing loss (2010).
Investigation 1.14 95% confidence interval (.1698, .2062) All 3 methods will give very similar results Interpretation of interval: I m 95% confident that between 17.1% and 20.7% of all US teens have some level of hearing loss. Note: consistent with failing to reject H0: = 0.20 Interpretation of level: If this process was used in lots of samples from the same population, in the long run 95% of the created intervals would capture the actual population proportion of US teens with hearing loss
Also keep in mind Nonsampling errors Even when have a random sample, other things can go wrong (not about how the sample was selected) People don t want to admit the truth/social desirability (e.g., which candidate they plan to vote for) People aren t ready to make an informed decision The wording of the question can bias responses (e.g., collided vs. crashed, allow vs. forbid) The demeanor of the interviewer
Investigation 1.18 25 women in the 2023 U.S. senate 0.25 1 0.25 100 0.25 1.96 I m 95% confident that between 16.5% and 33.5% of the world population is female? I m 95% confident that between 116.5% and 33.5% of the 2023 U.S. senate were female? Moral: Need a good random sample
Investigation 1.17 25.4% of 50,347 American households own a cat Population proportion differs from 1/4? Much different from 1/4? Moral: statistical significance practical significance
Statistical vs. Practical Significance When you are dealing with a large sample, the hypothesis test becomes capable of detecting numerically small differences from the hypothesized population proportion. However, in the real world, such small deviations may not be of great importance. For instance, in the context of this investigation, it doesn't make much of a notable difference to say that 25% of all homes own at least one pet compared to 25.02-25.08% even though this difference is statistically significant. In summary, statistical significance is determined by the p-value, indicating the likelihood of observing such an effect by chance regardless of the difference, however, practical significance would consider whether the observed difference is large enough to be meaningful in real life. Statistical significance means that a sample result is mathematically unlikely to happen by chance, which is different from practical significance, which means the result has meaningful implications. This distinction is important because with larger sample sizes seemingly minor differences in sample proportions may be statistically significant due to a lack of variation in sample proportions. A result can be statistically significant and not be practically significant.
Example: Voter Turnout Statistic: In 1996, 68.2% of random sample of 2613 eligible voters claimed to have voted Parameter: FEC reports 49.0% actually voted What are some possible explanations for why these values differ? Those in sample do not represent population Those in sample were not honest Statistics vary from sample to sample and may differ from parameter by chance Which of these explanations can we eliminate?
Example: Voter Turnout How surprising is it to find a sample proportion like 0.682 if the population proportion is 0.490 by random chance alone? n = 2613, = .490 Finite population? Continuity correction? p-value? Test statistic?
Exam 1 Format will be similar to HW, investigations, quizzes, review problems (several questions on same scenario) But you don t have to answer (a) to answer (b) etc. Very little if any multiple choice You will not be expected to use any technology on Exam 1 (no applets, R, JMP) You will be expected to interpret output (see review problems), explain what you would ask the technology to do, explain how output would change You can bring one 8.5x11 page of notes (two-sided) Submit when submit exam, will be returned (name)
Types of problems Calculation problems Standard deviation, z-statistic, confidence interval What do the simulations tell us? Setting up analysis Assess evidence vs. estimate parameter Choice of method Evaluating results, output, interpretations Validity Sample selection issues, inc. nonsampling errors Generalizability Interpretations, properties, what if ?
Study Advice Study like it is a closed book exam Organize your notes but don t expect much hunting and reading time Work problems on a blank piece of paper See Module discussions, Investigation solutions, end of chapter examples, Glossary, Chapter summary, Choice of procedures summary boxes Be ready for Careful interpretation in own words Extending what you have learned in new ways Will not involve simple replication of previous exercises or stating definitions
Study Advice, cont. Work out problems from scratch Then review solutions (HW, practice questions, quizzes, review questions, end of chapter examples) What is Step 1? How do I start Try what went wrong problems? See also technology guides, glossary Ask more questions, Review Canvas Q&A See individual responses
Test-taking Advice Exam worth approximately 50 points Mostly 2-4 pt questions Often do not have to answer questions (even subparts) in order Get something written down Start with a well-labeled sketch? Translate into symbols? Make sure to explain your reasoning Words to avoid: It, Proof, Data, Results, Accurate Words to only use when you mean it: probability, confidence, significant, random
Terminology cautions Percentage vs. proportion (vs. number of) Sample population ?? Bias vs. precision (vs. representative, accurate) Bias is about the method, not one sample Number of samples vs. sample size Generalizability: To what larger population or process are you willing to apply these conclusions Confidence vs. Significance Significant vs. substantial difference Evaluate (decision) vs. Interpret (what measuring)
Big Picture Based on the sample statistic, what can we say about the larger population or process? Or at least about some summary of the population (parameter) Is the sample representative? Yes, if used good sampling methods (and guarded against non-sampling errors) How much random chance variation could we expect to see? Looked at various probability models (e.g., binomial, normal) for the distributions of (standardized) statistics 1. 2.
Big Picture Draw conclusions about process/population 1) Measure the strength of evidence against a particular claim about the process/population Ho/Ha p-value (simulation, binomial, normal probability model) test statistic (# of SDs away, standardizing ) 2) Estimate the parameter based on the observed statistic Plausible values/Confidence interval/Confidence level Simulation/Binomial/Normal probability model (Plus Four) estimate + margin-of-error
Binomial process Two outcomes: success and failure Independent trials: next outcome does not depend on result of previous trials Constant probability of success: trials are identical, nothing changing over time Fixed number of trials: Not go until something happens