Road Safety Audits: Status Quo Analysis 2019
Investigation into the status quo of road safety audits in 2019 revealed slow implementation due to lack of institutional knowledge and training. The involvement of RTMC as a lead implementing agent, positive support from SANRAL, and training provided by SARF have led to higher levels of awareness and motivation to improve the road safety audit status in South Africa.
Download Presentation

Please find below an Image/Link to download the presentation.
The content on the website is provided AS IS for your information and personal use only. It may not be sold, licensed, or shared on other websites without obtaining consent from the author.If you encounter any issues during the download, it is possible that the publisher has removed the file from their server.
You are allowed to download the files provided on this website for personal or commercial use, subject to the condition that they are used lawfully. All files are the property of their respective owners.
The content on the website is provided AS IS for your information and personal use only. It may not be sold, licensed, or shared on other websites without obtaining consent from the author.
E N D
Presentation Transcript
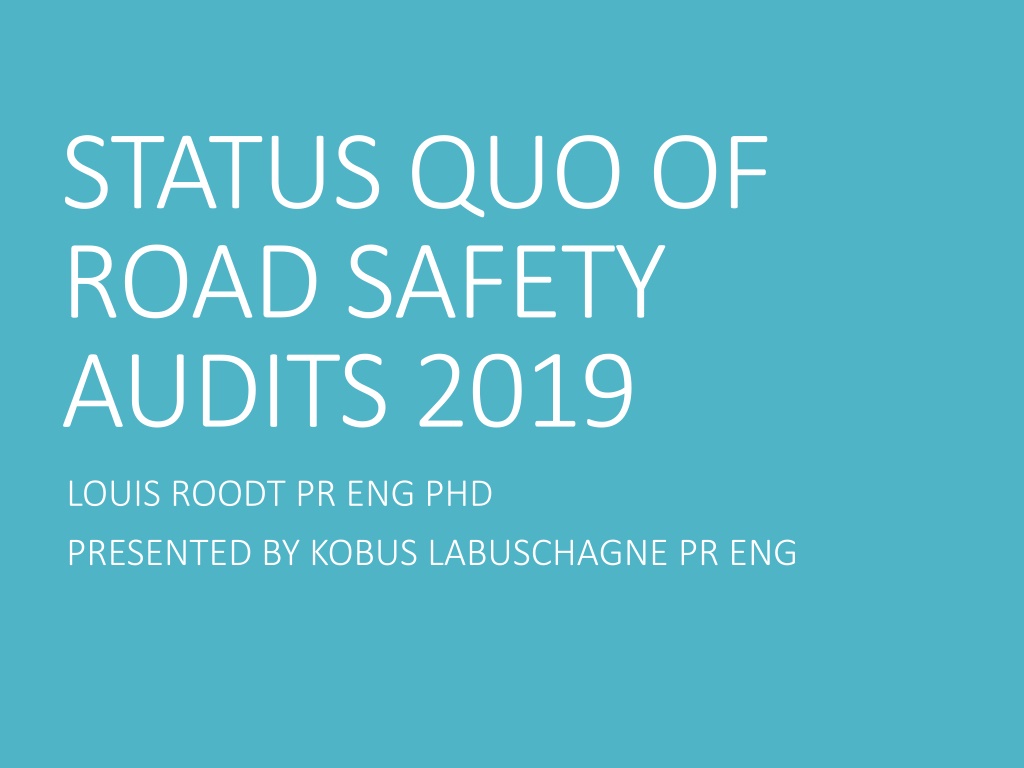
STATUS QUO OF ROAD SAFETY AUDITS 2019 LOUIS ROODT PR ENG PHD PRESENTED BY KOBUS LABUSCHAGNE PR ENG
A SATC PAPER IN 2002 REVIEWED THE STATUS QUO OF ROAD SAFETY AUDITS FOLLOWING THE DRAFT SOUTH AFRICAN ROAD SAFETY MANUAL VOLUME 4 PUBLISHED 1999: STATUS QUO OF ROAD SAFETY AUDIT 2019 SLOW IMPLEMENTATION DUE TO LACK OF INSTITUTIONAL KNOWLEDGE AND TRAINING THE 2012 EDITION OF SOUTH AFRICAN ROAD SAFETY AUDIT MANUAL PUBLISHED BY RTMC LEAD TO INCREASED AWARENESS IMPLEMENTATION ON SANRAL PROJECTS TRAINING PROVIDED BY SARF
LOW LEVELS OF AWARENESS BY ROAD AUTHORITIES MANY ROAD AUTHORITIES COULD NOT BE CONTACTED RSA STATUS QU0 IN 2002 POOR UNDERSTANDING OF PROCESSES LOW AWARENESS OF BENEFITS LACK OF TRAINED RS AUDITORS LACK OF TRAINING OPPORTUNITIES NO BUDGET SUPPORT SPORADIC PROJECTS IMPLEMENTED WITH NO FOLLOW UP
HIGHER LEVELS OF AWARENESS INVOLVEMENT OF RTMC AS LEAD IMPLEMENTING AGENT POSITIVE SUPPORT BY SANRAL FOR OWN PROJECTS POSITIVE SUPPORT BY CERTAIN PROVINCIAL AND METROPOLITAN ROAD AUTHORITIES SARF FACILITATING RSA TRAINING SINCE 2015 MORE THAN 450 PERSONS ATTENDED THE FIRST 2 DAYS = MANAGEMENT ORIENTATION COURSE MOTIVATION TO DO RSA STATUS QUO IN 2019
Design of investigation Not intended as random sample of civil engineers RSA SQ 2019 Not intended as interrogation of road authorities Survey sent to all persons in the SARF data base.
182 government officials 11 national government 75 SANRAL 38 provincial road authorities (25 from Western Cape Province) and 58 from municipalities (31 from City of Cape Town) EMPLOYMENT OF PARTICIPANTS 4 from the RTMC 20 from other SADC countries
210 persons from the consulting engineering profession 20 each representing Aurecon, RHDHV and SMEC EMPLOYMENT OF PARTICIPANTS 9 representing AECOM 6 each representing WSP Group, Gibb, ITSE and TS Consulting
OBJECTIVES : SURVEY PART 1 PROFILE OF PARTICIPANTS EXPERIENCE QUALIFICATIONS BACKGROUND ATTITUDE TRAINING: MATERIAL PRESENTATION
PRIMARY FIELD OF STUDY OF THE 41 RESPONDENTS: 39 FROM TECHNICAL BACKGROUND 1 FROM COMMERCIAL BACKGROUND 1 FROM POLICING BACKGROUND
YEARS OF EXPERIENCE GROUPS: 10 TO 20 YEARS ACCOUNT FOR 46% 20 TO 30 YEARS 8% (ILLUSTRATES MISSING GENERATION) 30 YEARS + OLD ENGINEERS (TO BE MENTORS)
QUALIFICATIONS B ENG HONS 36% B ENG 30% M ENG 20% PDH 4% ROAD SAFETY AUDITORS TYPICALLY HIGHLY QUALIFIED
COURSE ATTENDED SARF COURSE ATTENDED MORE THAN 5 YEARS AGO 46% SARF COURSE ATTENDED LESS THAN 5 YEARS AGO 44%
WAS THE COURSE WORTHWHILE 80% OF ALL 80% OF ALL RESPONDENTS RESPONDENTS FOUND THE FOUND THE COURSE VERY COURSE VERY TO EXTREMELY TO EXTREMELY WORTHWHILE WORTHWHILE
QUALITY OF COURSE PRESENTATIONS 25% RATED AS 25% RATED AS VERY HIGH VERY HIGH QUALITY QUALITY 65% RATED AS 65% RATED AS HIGH QUALITY HIGH QUALITY
RELEVANCE OF COURSE MATERIAL 88% OF 88% OF RESPONDENTS RESPONDENTS FOUND THE FOUND THE MATERIAL VERY MATERIAL VERY TO EXTREMELY TO EXTREMELY RELEVANT RELEVANT
ATTITUDE TOWARDS SAFETY 27% EXISTING 27% EXISTING POSITIVE ATTITUDE POSITIVE ATTITUDE 29% ATTITUDE 29% ATTITUDE CHANGED CHANGED SOMEWHAT SOMEWHAT 34% ATTITUDE 34% ATTITUDE CHANGED CHANGED SIGNIFICANTLY SIGNIFICANTLY POSITIVE POSITIVE
CONCLUSIONS SURVEY PART 1 Training that was lacking in 2002, has reached many road safety professionals, especially since 2015 when the SARF started to present an RSA course. More than 480 persons have attended first two days of training. The fact that 20 road safety auditors are from other SADC countries, indicates progress in the recognition of road safety in a regional context. Trained auditors are overall satisfied with the training and the course material presented.
OBJECTIVES : SURVEY PART 2 EXECUTION OF AUDITS ROLES INFORMATION VALUE PROCESSES FOLLOWED MEETINGS FEEDBACK IMPLEMENTATION
ROLES OF RESPONDENTS As road authority letting tenders for audits As consultant letting tenders on behalf of road authorities As consultant tendering (not successful) 17.86% 7.14% 28.57% As consultant tendering (successful) 25.00% As specialist road safety auditor 21.43%
ROAD SAFETY AUDITS ADD VALUE 57% STRONGLY 57% STRONGLY AGREE AGREE 35% AGREE 35% AGREE 7% NEUTRAL 7% NEUTRAL
PRICES OF AUDITS v QUALITY 54% ARE OF THE 54% ARE OF THE OPINION THAT OPINION THAT TENDERED PRICES ARE TENDERED PRICES ARE TOO LOW TO ENSURE TOO LOW TO ENSURE QUALITY QUALITY 46% RESPONDED THAT 46% RESPONDED THAT CLIENTS STILL GET CLIENTS STILL GET ADEQUATE TO HIGH ADEQUATE TO HIGH QUALITY DESPITE LOW QUALITY DESPITE LOW PRICES PRICES
TENDERS COMPILED FOR CLIENT 30 RESPONDENTS: 63% NONE 27% UP TO 5 9% MORE THAN 10
Consultants tendered SUCCESS IN TENDERING FOR AUDITS unsuccessfully on all audits (48%), successfully on one to five audits (36%%), six to 10 audits (12%) and 11 to 20 audits (4%). With 48% of consultants never winning a tender and 16% winning six and more tenders, it seems that the audit industry is dominated by a few players.
APPROPRIATE PROCESSES FOLLOWED? ALL THE ALL THE FORMAL FORMAL PROCESSES ARE PROCESSES ARE FOLLOWED IN FOLLOWED IN ONLY 26% OF ONLY 26% OF THE CASES THE CASES All processes followed No commencement or completion meeting and no feedback: No completion meeting and no feedback 26% No feedback 26% 16% 20%
SUFFICIENT INFORMATION TRUE IN ONLY TRUE IN ONLY 40% OF CASES 40% OF CASES
IMPLEMENTATION OF RECOMMENDATIONS 50%
FORMAL RESPONSE ONLY IN 20% OF ONLY IN 20% OF CASES ARE CASES ARE FORMAL FORMAL RESPONSES RESPONSES RECEIVED RECEIVED
Aspects that need attention are the following: Auditing process are followed but certain steps are sometimes omitted, i.e. lack of commencement and completion meetings and feedback, recommendations are not always implemented. Formal responses must be given. Design engineers do not always provide sufficient information to do the audits. CONCLUSIONS SURVEY PART 2
The status quo of road safety audits in South Africa in 2019 seems to be healthy and improving as the skills set develops and commitments by road authorities become institutionalised. It is, however, a reason for concern that the field is dominated by a few players. CONCLUSIONS
Thank you AUTHOR: Dr. Louis Roodt Pr Eng ldvroodt@gmail.com PRESENTER: Kobus Labuschagne Pr Eng flabusc@gmail.com
