Reshaping Indian Railways: A Legacy of Transformation
Indian Railways, one of the world's largest rail networks, underwent a significant turnaround led by Prasad, focusing on performance improvement and implementing systemic reforms. The historical journey of Indian Railways, from its colonial roots to becoming a vital national lifeline, is characterized by impactful changes and organizational restructuring. The organizational hierarchy, with a specialized railway board, played a crucial role in shaping the future of this public-sector giant.
Download Presentation

Please find below an Image/Link to download the presentation.
The content on the website is provided AS IS for your information and personal use only. It may not be sold, licensed, or shared on other websites without obtaining consent from the author.If you encounter any issues during the download, it is possible that the publisher has removed the file from their server.
You are allowed to download the files provided on this website for personal or commercial use, subject to the condition that they are used lawfully. All files are the property of their respective owners.
The content on the website is provided AS IS for your information and personal use only. It may not be sold, licensed, or shared on other websites without obtaining consent from the author.
E N D
Presentation Transcript
Indian Railways: Building a Indian Railways: Building a Permanent Legacy Permanent Legacy Harvard Business School 9 710-008 Rev : October 1, 2009 Tarun Khanna Aldo Musacchio Rachna Tahulyani
Prasad had led Indian Railways through one of the most impressive business turnarounds in recent history In 2004, Prasad had given the railway board and Kumar the operational task of turning around the railways. They had focused on getting everyone to improve the performance of Indian Railways organizations. Implemented reforms with a consensus-based approach and made sure the reforms had developed deep roots within the institutions By 2009 Prasad and his team felt that policy reforms have been embedded in the institutionalized DNA by instating systemic and procedural reforms. These have become part of the organizational routine, manuals and to some extend norms.
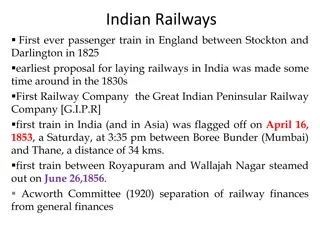
A Nations Lifeline A Nation s Lifeline Indian Railways was one of the largest and busiest rail networks in the world, carrying over 17 million passengers and 2 million tons of freight every day Colonial Inheritance (1858 1947) 1853 the first train ran on India soil from Mumbai (the commercial capital of the country) to Thane (suburb) 1870 The governor general of India had initiated the construction of minor state lines on narrow- gauge tracks in order to develop traffic to the hinterland 1875 British companies had invested about 95 million in Indian guaranteed railways 1880 The route mileage of IR entire network was about 14500 kilometers 1905 A railway board was formed under the Department of Commerce and Industry 1924 the government took over the management of the railways and separated its financing and budget from that of other government departments 1947 40% of the railways became part of the newly created nation of Pakistan
ORGANIZATIONAL HIERARCHY The government of India s ministry of railways operated IR who was assisted by two ministers of state for railways. Each of ministers has railway board (such as chairman railway board, a financial commissioner, and six functional members) with direct influence on the future Members of the railway board were highly specialized in the functions they represented and had vast experience in each of their field.
THE PUBLIC-SECTOR GIANT At the end of twentieth century, IR had become inward looking organizations. Over a span of 50 years after independence, IR's share of passenger traffic declined, lost most of its business to bus transportation and airlines); and its share of good increased because of trucking industry gains, which had been facilitated by more accessible roads and by IR's capacity limitations The economic reforms of the 1990s had led to a lowering of trade and tariff barriers and exposed Indian firms to international competition. Although progress in actual investment in these new lines is small, this activity does divert engineering and managerial resources to a significant extent, detracting from other serious tasks Firing workers or changing their salaries was another costly political battle that no minister of railways wanted to fight, especially if it meant risking his own political career IR s financial crisis culminated in 2001 when IR was compelled to defer the dividend payable to the government
A Break from the Past A Break from the Past In 2004, IR was in dire financial straits Freight Operations : Faster and Heavier Trains The long-term strategy of increasing freight rates regularly to protect railway profitability had driven freight customers to other modes of transport Faster trains referred to a reduction in turnaround time Heavier trains meant that IR managers could increase profits without having to increase their rolling stock Simplify cumbersome procedure Raising tariffs to transport certain commodities required that IR s management focus on the elasticity in demand for railway services IRmade significant investment in technology to enhance productivity
PASSENGER BUSINESS IR s core problem in the passenger segment was that more 90% of the traffic was in the low- price segments The key challenge : maintain its obligations on the lower price services, while at the same time increasing its capacity and utilization of upper-class services Ministers had resisted fare hikes in politically sensitive segments suburban, ordinary passenger, and second-class mail and express trains A simple strategy increase volumes, reduce unit costs IR enhanced the Tatkal (immediate) service More trains qualified as superfast, which increasedIR sprofitability because it could charge higherfares for superfast trains. IR leveraged technology to enhance the customer experience
LARGEST EMPLOYER IN THE WORLD IR had 1.4 million employees who politically were untouchable IR addressed the issue of downsizing by focusing on labor productivity, cross- functional work, and speedy execution. An increase in IR s volume of passenger and freight business led to enhanced productivity in the form of an increase in ton kilometers per employee and passenger kilometers per employee.
IMPROVING THE INFRASTRUCTURE In order to address the capacity constraint One overall solutions to improve the infrastructure was to privatize some lines Encouraged public-private partnerships in noncore areas Cash incentives Issuing debt
Was It Organizational Was It Organizational Change or Good Change or Good Management? Management? CIVIL SERVANT AS MANAGERS: THE EXAMPLE OF SUDHIR KUMAR Implement the Prasad s policy As mediator between Prasad and the railways board Help the Financial Commissioner improve IR s fiscal health Kumar is well-known as the railway minister s right-hand man and masterminding the financial turnaround of the IR
THE MOTIVATED MINISTER LALU PRASAD YADAV His reputation as a politician concerned with the welfare of the poor When he was appointed as Minister of Railways, his initial drive to show good results gained him sympathy from the public and the international press Prasad s political approach was based on mass mobilization of the poverty stricken lower-caste and Muslim votes
Permanent Legacy Permanent Legacy Serious challenges ware ahead, even though Prasad and Kumar had institutionalized some of their reforms (for instance, the change in axle load of the trains) There were negative and positive pressures on the performance of IR IR aspired to world-class benchmarks in train speeds, rolling stock, and passenger-traffic profitability Had Prasad and Kumar succeeded in embedding change into the minds of IR workers and staff? Had they built a lasting legacy?
Comparison of Railway Comparison of Railway Networks Networks 2005 India China U.S. (All Class IR) Size and Scale Indicators Total Route Km 63,465 62,200 153,787 Passengers ( 000) 5,378,000 1,106,510 N.A. Passenger Km (millions) 575,702 583,320 N.A. Freight Tons (millions) 602 2,309 1,723 Freight Ton Km (millions) 407,398 1,934,612 2,478,914 Passenger Revenue (2000 constant $ millions) 2,706 6,578 N.A. Freight Revenue (2000 constant $ millions) 5,311 16,493 41,129 Staff 1,422,200 1,665,588 162,438
2005 India China U.S. (All Class IR) Productivity Indicators Operating Ratio with Normalizationc 95a 116.75b 82 Average Lead Freight (km) 677 838 1,439 Average Lead Passenger (km) 107 527 N.A. Employee Productivityd 691 1,512 15,261 Employee per Km of Line 22 27 1.06 Total Wages per Total Revenues 0.48 0.16 0.28 Ratio of Passenger Fares to Freight Rates 0.36 1.32 N.A. Traffic Density ( 000 of TU per ton km) 15,490 40,481 16,119 Wagon Productivity ( 000 of ton km per wagon) 1,832 3,571 1,922 Coach Productivity (000 of Pkm per Coach +MU)e 13,667 14,464 N.A. 131,152a Locomotive Productivity (000 of TU per Loco + MU/MU Factory)f 116,120 106.859 U.S. $ PPP Passenger Revenue per passenger km (ICP), 2000 0.023 0.053 N.A. U.S. $ PPP Freight Revenue per ton km (ICP), 2000 0.064 0.040 0.016
Thank You Thank You
