REPORT TO THE CAPITAL MARKET COMMITTEE
In this report to the Capital Market Committee, data on market numbers, quarterly trade activity, and market expansion/enhancement are presented. Key highlights include market performance indicators, dematerialization trends, trade volumes, and the introduction of new trading platforms. The report also covers upcoming initiatives aimed at enhancing market efficiency and transparency.
Download Presentation

Please find below an Image/Link to download the presentation.
The content on the website is provided AS IS for your information and personal use only. It may not be sold, licensed, or shared on other websites without obtaining consent from the author.If you encounter any issues during the download, it is possible that the publisher has removed the file from their server.
You are allowed to download the files provided on this website for personal or commercial use, subject to the condition that they are used lawfully. All files are the property of their respective owners.
The content on the website is provided AS IS for your information and personal use only. It may not be sold, licensed, or shared on other websites without obtaining consent from the author.
E N D
Presentation Transcript
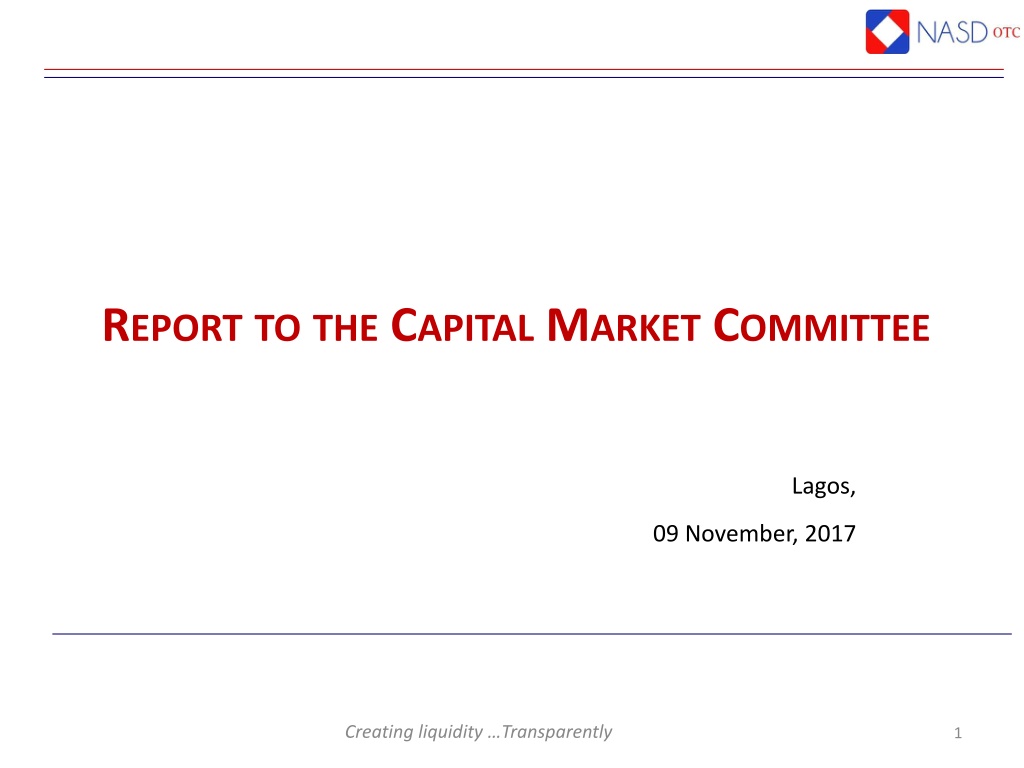
REPORT TO THE CAPITAL MARKET COMMITTEE Lagos, 09 November, 2017 Creating liquidity Transparently 1
MARKETIN NUMBERS Q3 17 Q2 17 Q1 17 Admitted Securities 34 34 33 AGMs held 7 2 2 Volume Dematerialized 29.46 billion 21.68 billion 21.68 billion Total Share Capital 111.22 billion 108.87 billion 108.87 billion Dematerialized (%) 26.48 19.91 19.91% Operating/Registered PI s 99/123 99/123 99/123 Equities Market Number of Trades 641 741 700 Volume of Trades 522.89 million 143.30 million 203.54 million Value Traded 861.80 million 884.23 million 1.01 billion Bonds Market Number of Trades 9 10 10 Volume of Trades 10.04 million 6.61 million 6.61 million Value Traded in 1.04 billion 661.76 million 661.76 million 26/02/2025 Creating liquidity Transparently 2
QUARTERLYTRADEACTIVITY Value Traded ( million) Activity 5000 70000 12000 4500 60000 10000 4000 50000 8000 3500 40000 6000 3000 30000 2500 4000 20000 2000 2000 10000 1500 0 0 1000 Q1 Q2 Q3 Q4 Q1 Q2 Q3 Q4 Q1 Q2 Q3 Q4 Q1 Q2 Q3 500 0 2014 2015 2016 2017 -500 Q3 Q4 Q1 Q2 Q3 Q4 Q1 Q2 Q3 Q4 Q1 Q2 Q3 Q4 Q1 Q2 Q3 Value Traded ( million) Volume Traded (million units) Deal Count 2013 2014 2015 2016 2017 USI & Market Cap 1600 1400 1200 561.64 505.53 1000 437.17 427.86 423.89 423.89 419.76 411.28 800 406.08 389.85 359.76 359.76 600 400 200 0 Q2 Q3 Q4 Q1 Q2 Q3 Q4 Q1 Q2 Q3 2016 2017 USI Market Capitalisation ( ) 26/02/2025 Creating liquidity Transparently 3
MARKET EXPANSION /ENHANCEMENT Received no objection to run Enterprise Portal Launch in January 2018 Reintroduction of BiTS trading platform Proprietary system now operational Training commenced in August 2017 Number of AGMs in the Q3 7 Total 11 out of 34 companies 26/02/2025 Creating liquidity Transparently 4
