Remittances Trends in Africa Insights

Remittances Trends in
Africa
Presented By : David Ndegwa
Addis Ababa, Ethiopia. 26 October 2017.
Contents
•
Introduction
•
Main Trends
•
Cost of Sending
•
Challenges
Introduction
IMF defines remittances as
"household
income from foreign economies arising
mainly from the temporary or
permanent movement of people to
those economies. Remittances include
cash and non-cash items that flow
through formal channels, such as via
electronic wire, or through informal
channels, such as money or goods
carried across borders…".
Main Trends: Remittances still larger
than ODA in 2016
Source: World Bank
Decrease
from 2015
estimates of
about $441
billion to
developing
countries,
nearly three
times the
amount of
ODA.
Remittances to developing countries expected
to grow
Source: World Bank
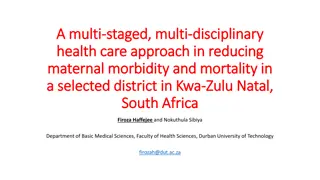
Remittances in absolute figures and as a
share of GDP (2015)
Source: Hein de Haas
Remittances as percentage of GDP for selected
countries (those where its higher than 4% of GDP) in
2015
Source: World Bank
Cost of sending
•
According to WB report the global average cost of sending $200 at
7.45 percent in the first quarter of 2017 higher than the SDG goal of
3 per cent.
•
Higher in Sub-Saharan Africa at 9.8 per cent
•
According the WB Cutting prices by at least 5 percentage points can
save up to $16 billion a year.
•
The Send Money Africa (SMA) data base by the AU’s African Institute
for Remittances tracks cost of sending to Africa and within on
quarterly basis
•
Their latest estimate was for Q4 2016 (12th – 16th December 2016)
at 9.05 per cent
•
Challenge of lowering cost remains but promising new tools (apps)
such as
Xoom
by PayPal are fast and cheaper
•
Just yesterday new free open source software
Mojaloop
application
was launched-developed under the Bill and Melinda Gates’s
Foundation Level One Project to provide interoperability between
financial institutions and payment service providers
•
Other numerous startups leveraging smartphone apps such as
Mpesa
and others have opened doors for service providers to tap into the
lucrative market (SMA has lengthy glossary of different types of
services)
R
e
m
i
t
t
a
n
c
e
s
C
h
a
l
l
e
n
g
e
s
r
e
m
a
i
n
•
Insufficient data quality and capacity for
analysis
•
Many unofficial transfers not reflected in
data
•
High cost of transfer persist
•
Inadequate competition keeping cost high
•
Inadequate regulation to increase
competition for lowering costs
In-depth analysis of remittances in Africa as presented by David Ndegwa in Addis Ababa, Ethiopia. The content covers definitions, main trends, challenges, and data on remittance flows to developing countries. Explore remittance patterns, impacts on GDP, and trends in selected African nations.

Download Presentation

Please find below an Image/Link to download the presentation.
The content on the website is provided AS IS for your information and personal use only. It may not be sold, licensed, or shared on other websites without obtaining consent from the author.If you encounter any issues during the download, it is possible that the publisher has removed the file from their server.
You are allowed to download the files provided on this website for personal or commercial use, subject to the condition that they are used lawfully. All files are the property of their respective owners.
The content on the website is provided AS IS for your information and personal use only. It may not be sold, licensed, or shared on other websites without obtaining consent from the author.
E N D
Presentation Transcript
Remittances Trends in Africa Presented By : David Ndegwa Addis Ababa, Ethiopia. 26 October 2017.
Contents Introduction Main Trends Cost of Sending Challenges
Introduction IMF defines remittances as "household income from foreign economies arising mainly from the permanent movement of people to those economies. Remittances include cash and non-cash items that flow through formal channels, such as via electronic wire, or through informal channels, such as money or goods carried across borders ". temporary or
Main Trends: Remittances still larger than ODA in 2016 Decrease from 2015 estimates of about $441 billion to developing countries, nearly three times the amount of ODA. Source: World Bank
Remittances to developing countries expected to grow Source: World Bank
Remittances in absolute figures and as a share of GDP (2015) Figure 18. Remittance receipts, absolute and as percentage of GDP, 2016 20,000 40% 18,000 35% Remittances ($ millions) 2016 16,000 30% 14,000 Remittacnes, as % of DGP Remittances, $ million 25% 12,000 10,000 20% 8,000 15% 6,000 Remittances as a percentage of GDP 10% 4,000 5% 2,000 0 0% Niger Liberia Nigeria Benin Morocco Cote d'Ivoire Cabo Verde Burkina Faso Lesotho Togo Guinea Zimbabwe South Africa Djibouti Madagascar Algeria Comoros Tunisia Tanzania Ghana Senegal Uganda Mali Mauritius Sudan Sierra Leone Kenya Gambia, The Rwanda Mozambique Ethiopia Cameroon Egypt, Arab Rep. World Development Indicators, World Bank, 2016 data Source: Hein de Haas
Remittances as percentage of GDP for selected countries (those where its higher than 4% of GDP) in 2015 4.0% Uganda Djibouti 4.0% Madagascar 4.3% Nigeria 4.4% Tunisia 4.6% Egypt, Arab Rep. 5.5% Ghana 5.5% Guinea-Bissau 5.7% Mali 6.3% Morocco 6.9% Togo 9.1% Cabo Verde 12.3% Senegal 13.9% Lesotho 17.5% Comoros 19.9% The Gambia 22.4% Liberia 31.2% 0.0% 5.0% 10.0% 15.0% 20.0% 25.0% 30.0% 35.0% Source: World Bank
Cost of sending According to WB report the global average cost of sending $200 at 7.45 percent in the first quarter of 2017 higher than the SDG goal of 3 per cent. Higher in Sub-Saharan Africa at 9.8 per cent According the WB Cutting prices by at least 5 percentage points can save up to $16 billion a year. The Send Money Africa (SMA) data base by the AU s African Institute for Remittances tracks cost of sending to Africa and within on quarterly basis Their latest estimate was for Q4 2016 (12th 16th December 2016) at 9.05 per cent Challenge of lowering cost remains but promising new tools (apps) such as Xoom by PayPal are fast and cheaper Just yesterday new free open source software Mojaloop application was launched-developed under the Bill and Melinda Gates s Foundation Level One Project to provide interoperability between financial institutions and payment service providers Other numerous startups leveraging smartphone apps such as Mpesa and others have opened doors for service providers to tap into the lucrative market (SMA has lengthy glossary of different types of services)
Remittances Challenges remain Remittances Challenges remain Insufficient data quality and capacity for analysis Many unofficial transfers not reflected in data High cost of transfer persist Inadequate competition keeping cost high Inadequate regulation to increase competition for lowering costs