Progress Presentation of Autonomous Underwater Robots
This presentation showcases the progress made by a team in developing autonomous underwater robots at Bradley University. The project objectives include mapping underwater terrain, navigating a swarm of UAVs, obstacle avoidance, and generating final images. The presentation covers system block diagrams, original Gantt charts, tasks related to detection arrays, amplifier testing, circuit layout, and photodiode comparison results. Updates on the Gantt chart and circuit layout design are also discussed.
Download Presentation

Please find below an Image/Link to download the presentation.
The content on the website is provided AS IS for your information and personal use only. It may not be sold, licensed, or shared on other websites without obtaining consent from the author.If you encounter any issues during the download, it is possible that the publisher has removed the file from their server.
You are allowed to download the files provided on this website for personal or commercial use, subject to the condition that they are used lawfully. All files are the property of their respective owners.
The content on the website is provided AS IS for your information and personal use only. It may not be sold, licensed, or shared on other websites without obtaining consent from the author.
E N D
Presentation Transcript
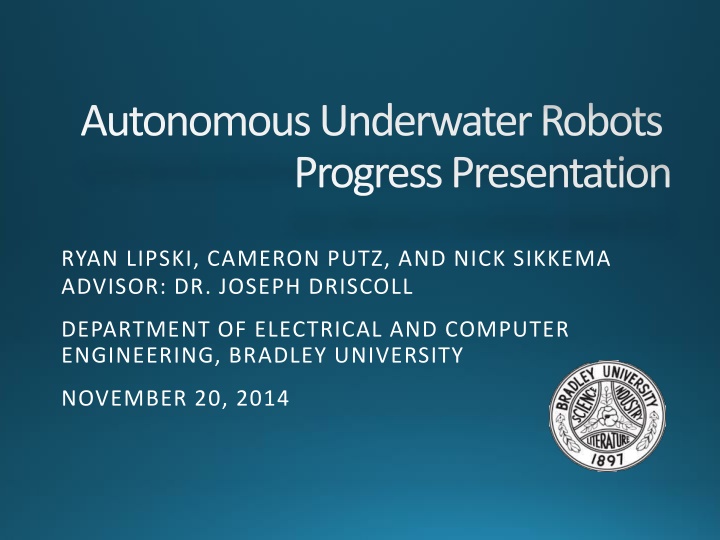
Autonomous Underwater Robots Progress Presentation RYAN LIPSKI, CAMERON PUTZ, AND NICK SIKKEMA ADVISOR: DR. JOSEPH DRISCOLL DEPARTMENT OF ELECTRICAL AND COMPUTER ENGINEERING, BRADLEY UNIVERSITY NOVEMBER 20, 2014
Project Objectives Map underwater terrain Swarm of UAV s Avoid obstacles Generate final image 2
Original Gantt Chart Cameron Putz PERCENT November October ACTIVITY DURATION COMPLETE 4 6 11 13 18 20 2 7 9 14 16 21 23 28 30 0% Detection Array Simulation and Testing Circuit and System Layout 27 8 0% 0% Assemble and Test Single Submarine 34 Fall Progress Presentation Plan %Complete 4
Task 1: Detection Array Experiment Amplifier testing Amplifier Design Model of photodiode Everlight photodiode [2] Osram photodiode [1] 5 Transimpedance amplifier
Task 1: Detection Array Results Photodiode testing Osram photodiode [1] Everlight photodiode [2] Saturation 36 inches 4.9 Volts 4 inches 4.89 Volts Max Distance 180 inches 0.6 Volts 132 Inches -- 0.120 Volts Linearity Linear Non-Linear Ambient Light 100% Saturation 29% Saturation Price $8.85 $0.59 Photodiode comparison 6
Updated Gantt Chart Cameron Putz Task 2 PERCENT November October ACTIVITY DURATION COMPLETE 4 6 11 13 18 20 2 7 9 14 16 21 23 28 30 100% Detection Array Simulation and Testing Circuit and System Layout 57 8 0% 0% Assemble and Test Single Submarine 34 Fall Progress Presentation Plan %Complete 7
Task 2: Circuit Layout Results Eagle 7.1.0 Dr. Driscoll has experience First iteration of the detection array surface mount board 8
Task 2: Circuit Layout Results Eagle 7.1.0 Still a lot to learn First library package Everlight photodiode First library symbol Everlight photodiode 9
Updated Gantt Chart Cameron Putz Future work PERCENT November December October ACTIVITY DURATION COMPLETE 4 6 11 13 18 20 25 27 2 4 9 11 16 18 23 25 30 2 7 9 14 16 21 23 28 30 100% Detection Array Simulation and Testing Circuit and System Layout 57 27 35% 0% Assemble and Test Single Submarine 43 Fall Progress Presentation Plan %Complete 10
Original Gantt Chart Ryan Lipski PERCENT November October ACTIVITY DURATION COMPLETE 4 6 11 13 18 20 2 7 9 14 16 21 23 28 30 0% Motor Control and Power Design 22 0% Detection Array Testing and Validation Directional Guidance Algorithm Design 15 21 0% 0% Single Submarine Testing 34 Fall Progress Presentation Plan %Complete 11
Updated Gantt Chart Ryan Lipski Task 1 PERCENT November October ACTIVITY DURATION COMPLETE 4 6 11 13 18 20 2 7 9 14 16 21 23 28 30 0% Detection Array Testing and Validation Motor Control and Power Design 48 22 0% 0% Directional Guidance Algorithm Design 21 0% Single Submarine Testing 34 Fall Progress Presentation Plan %Complete 12
Task 1: Detection Array Experiment Bench top detection array Baffle configuration testing Baffle protrusion distance and LED distance experimented with LED swept from 0 to 180 while recording light intensity Baffle Photodiodes Baffle test setup 13
Task 1: Detection Array Results Bench top detection array Baffle configuration testing 12cm LED distance Detection zones Left vs right photodiode (5 mm baffle) 14
Task 1: Detection Array Experiment Additional related work Detection array testing/validation Assisted Cameron with testing different op-amp/photodiode combinations Both in lab testing and off campus/through water testing 15
Updated Gantt Chart Ryan Lipski Task 2 PERCENT November October ACTIVITY DURATION COMPLETE 4 6 11 13 18 20 2 7 9 14 16 21 23 28 30 100% Detection Array Testing and Validation Motor Control and Power Design 48 31 0% 0% Directional Guidance Algorithm Design 21 0% Single Submarine Testing 34 Fall Progress Presentation Plan %Complete 16
Task 2: Motor Control and Power Design and Experiment 3 DC brushed motors (x, y, z configuration) Y motor highest current draw: 860 mA peak draw Recorded with only rear propeller submerged X and y motor feedback: IMU Z motor feedback: pressure sensor 17
Task 2: Motor Control and Power Design I2C h-bridge (DRV8830) Single channel, PWM controlled h-bridge 1 A, 2.75 - 6.8 V Cost: $2.44 Total cost per submarine: $2.44 * 3 = $7.32 18
Task 2: Motor Control and Power Design H-bridge and I2C PWM generator H-Bridge (SN754410) 1.1 A Cost: $2.57 I2C PWM generator (PCA9685) Cost: $2.47 Requires more PCB surface area Total cost per submarine: $2.57*2 + $2.47 = $7.61 19
Task 2: Motor Control and Power Design PID control All 3 motors in same interrupt control loop ECE467 PID code used as starting point Updated to work with the I2C h-bridge (DRV8830) 20
Task 2: Motor Control and Power Design Power 4 NIMH AA batteries 1.2 V per cell 2500 mAh Battery life estimation Estimated average current draw: 1770 mA Estimated run time: 1.4 hours 21
Updated Gantt Chart Ryan Lipski Task 3 PERCENT November October ACTIVITY DURATION COMPLETE 4 6 11 13 18 20 2 7 9 14 16 21 23 28 30 100% Detection Array Testing and Validation Motor Control and Power Design 48 31 90% 0% Directional Guidance Algorithm Design 24 0% Single Submarine Testing 34 Fall Progress Presentation Plan %Complete 22
Task 3: Directional Guidance Algorithm Design Directional Guidance Flowchart 23
Updated Gantt Chart Ryan Lipski Future work PLAN START PLAN FINISH PERCENT November December October ACTIVITY DURATION COMPLETE 4 6 11 13 18 20 25 27 2 4 9 11 16 18 23 25 30 2 7 9 14 16 21 23 28 30 100% Detection Array Testing and Validation 10/2/2014 11/18/2014 Motor Control and Power Design 48 31 90% 10/16/2014 11/15/2014 20% Directional Guidance Algorithm Design 11/6/2014 11/29/2014 24 0% Single Submarine Testing 12/9/2014 1/22/2015 45 Fall Progress Presentation 24
Original Gantt Chart Nick Sikkema PERCENT November October ACTIVITY DURATION COMPLETE 4 6 11 13 18 20 2 7 9 14 16 21 23 28 30 0% Research Parts Multiplexer and Pressure Sensor 13 15 0% 0% Compass and Accelerometer 10 0% Directional Guidance Algorithm 21 0% Test Single Submarine 34 Fall Progress Presentation Plan %Complete 25
Task 1: Research Parts Research Microcontroller ADC Multiplexer (CD4051) Atmega328P Atmega328P breakout board [3] 26
Task 1: Research Parts Research Pressure sensor Package Gauge vs absolute MPAK package [4] Unibody package [4] 27
Updated Gantt Chart Nick Sikkema Task 2 PERCENT November October ACTIVITY DURATION COMPLETE 4 6 11 13 18 20 2 7 9 14 16 21 23 28 30 95% Research Parts Multiplexer and Pressure Sensor 55 15 0% 0% Compass and Accelerometer 10 0% Directional Guidance Algorithm 21 0% Test Single Submarine 34 Fall Progress Presentation Plan %Complete 28
Task 2: Multiplexer and Pressure Design and Experiment 8 to 1 multiplexer (CD4051) Pressure sensor (MPX53GP) Differential output Gauge vs absolute Call graph for the depth function 29
Task 2: Multiplexer and Pressure Results Multiplexer ADC test output 30
Updated Gantt Chart Nick Sikkema Task 3 PERCENT November October ACTIVITY DURATION COMPLETE 4 6 11 13 18 20 2 7 9 14 16 21 23 28 30 95% Research Parts Multiplexer and Pressure Sensor 55 55 95% 0% Compass and Accelerometer 10 0% Directional Guidance Algorithm 21 0% Test Single Submarine 34 Fall Progress Presentation Plan %Complete 31
Task 3: Compass and Accelerometer Design and Experiment Pololu library C++ conversion Code cleanup I2C Call graph for the read acceleration register function 32
Task 3: Compass and Accelerometer Results Heading test output Velocity test output 33
Updated Gantt Chart Nick Sikkema Future work PERCENT November December October ACTIVITY DURATION COMPLETE 4 6 11 13 18 20 25 27 2 4 9 11 16 18 23 25 30 2 7 9 14 16 21 23 28 30 95% Research Parts Multiplexer and Pressure Sensor 55 55 95% 100% Compass and Accelerometer 15 20% Directional Guidance Algorithm 21 0% Test Single Submarine 45 Fall Progress Presentation Plan %Complete 34
Autonomous Underwater Robots Progress Presentation RYAN LIPSKI, CAMERON PUTZ, AND NICK SIKKEMA ADVISOR: DR. JOSEPH DRISCOLL DEPARTMENT OF ELECTRICAL AND COMPUTER ENGINEERING, BRADLEY UNIVERSITY NOVEMBER 20, 2014
References [1] Silicon Photodiode for the Visible Spectral Range, OSRAM, [online] 2014, http://www.everlight.com/file/ProductFile/201407061648128798.pdf (Accessed: 19 November 2014). [2] RGB Color Light Sensor Surface Mount, Everlight, [online] 2013, http://www.everlight.com/file/ProductFile/201407061648128798.pdf (Accessed: 19 November 2014). [3] "Arduino," Arduino SA, [Online]. Available: http://arduino.cc/en/Main/arduinoBoardUno. [Accessed 19 11 2014]. [4] "Freescale," 10 2012. [Online]. Available: http://cache.freescale.com/files/sensors/doc/data_sheet/MPX2202.pdf. [Accessed 19 11 2014]. 36
Collision Detection Collision detection and tilt compensation 37
I2C Test LSM303DLHC Initialization I2C test 38
