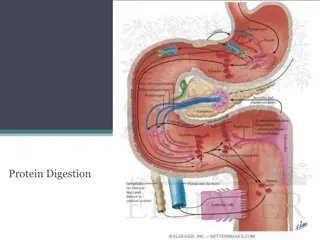
Optimizing CHO Bioprocesses with Amino Acid Prediction Tool
University of Massachusetts Lowell has developed a genome-scale model for Chinese Hamster Ovary (CHO) cells, enhancing bioprocess optimization. The Amino Acid Level Prediction Tool complements this, aiding in predicting key nutrient levels for improved process control. Supported by advanced algorithms and software, this tool facilitates predictive capabilities to monitor and control CHO bioprocesses efficiently.

Download Presentation

Please find below an Image/Link to download the presentation.
The content on the website is provided AS IS for your information and personal use only. It may not be sold, licensed, or shared on other websites without obtaining consent from the author.If you encounter any issues during the download, it is possible that the publisher has removed the file from their server.
You are allowed to download the files provided on this website for personal or commercial use, subject to the condition that they are used lawfully. All files are the property of their respective owners.
The content on the website is provided AS IS for your information and personal use only. It may not be sold, licensed, or shared on other websites without obtaining consent from the author.
E N D
Presentation Transcript
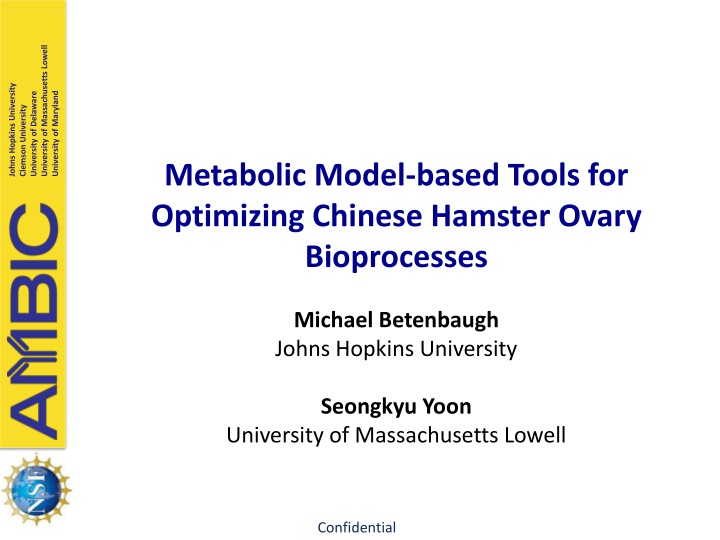
University of Massachusetts Lowell University of Massachusetts Lowell Johns Hopkins University Johns Hopkins University University of Delaware University of Maryland University of Delaware Clemson University Clemson University Metabolic Model-based Tools for Optimizing Chinese Hamster Ovary Bioprocesses Michael Betenbaugh Johns Hopkins University Seongkyu Yoon University of Massachusetts Lowell Confidential
Introduction University of Massachusetts Lowell University of Massachusetts Lowell genome-scale model developed for Chinese Hamster Ovary (CHO) cell (https://doi.org/10.1016/j.cels.2016.10.020) Stand-alone .exe version created using MATLAB 1stfunction: Amino acid level prediction tool for CHO cell culture 2ndfunction: Media optimization tool for CHO culture 3rdfunction: Clone analysis tool for CHO cell line This comprehensive tool combines three functions that utilize the Johns Hopkins University Johns Hopkins University University of Delaware University of Maryland University of Delaware Clemson University Clemson University Confidential
University of Massachusetts Lowell University of Massachusetts Lowell Johns Hopkins University Johns Hopkins University University of Delaware University of Maryland University of Delaware Clemson University Clemson University Amino Acid Level Prediction Tool for Chinese Hamster Ovary Cell Culture Michael Betenbaugh Johns Hopkins University Confidential
Introduction University of Massachusetts Lowell University of Massachusetts Lowell Johns Hopkins University Johns Hopkins University Objective for this tool: Facilitate CHO bioprocesses by providing predictive capabilities on key nutrient levels for improved process monitoring and control Use easy-to-measure inputs (cell density) to predict hard-to-measure properties (amino acid levels) University of Delaware University of Maryland University of Delaware Clemson University Clemson University Used Software and Algorithms: 1. Stand-alone .exe version created using MATLAB 2. COBRA Toolbox (https://opencobra.github.io/cobratoolbox/latest/index.html#), under GNU General Public License version 3.0 3. Developed ENM algorithm (doi.org/10.1038/s41540-019-0103-6) Confidential
University of Massachusetts Lowell Amino acid level prediction algorithm Johns Hopkins University University of Delaware AA prediction Growth behavior predicted by equation fitting/two-point extrapolation Essential AA level estimated by CHO model and ENM approach (published, doi.org/10.1038/s41540-019-0103-6) Switchable Kalman filter mitigates negative impact of input error Viable Cell Desnity (VCD) measurements and growth prediction precede Clemson University Confidential
Graphical User Interface (GUI) A Graphical User Interface (GUI) was made for AA level predictions University of Massachusetts Lowell University of Massachusetts Lowell Johns Hopkins University Johns Hopkins University University of Delaware University of Maryland University of Delaware Clemson University Clemson University Input and initialize Prediction parameters setting Output Confidential
Input Data and Model University of Massachusetts Lowell University of Massachusetts Lowell Johns Hopkins University Johns Hopkins University Files to be loaded into the GUI: Genome-scale model input into this GUI in .mat (MATLAB) format Input data (cell density, initial amino acid levels) in Excel format University of Delaware University of Maryland University of Delaware Clemson University Clemson University Required input data: 1stline: Culture time; 2ndline: VCD measurement; 1stcolumn: initial amino acid levels For record and comparison: Amino acid level measurements Confidential
Prediction Method Selection and Parameter Setting University of Massachusetts Lowell University of Massachusetts Lowell Johns Hopkins University Johns Hopkins University University of Delaware University of Maryland University of Delaware Clemson University Clemson University Growth estimation method can be selected: Fitting, Logistic growth equation (needs >3 VCD measurements) 1. Fitting, Exponential growth equation (needs >3 VCD measurements) 2. Two-point extrapolation method (needs > 2 VCD measurements) 3. Default method (run all fitting methods and select the fitting that gives the largest R2value; two-point extrapolation if R2< 95% ) 4. Users can choose to predict future level after how many hours Kalman filter can be turned on/off; estimated measurement and prediction errors are needed for input Confidential
University of Massachusetts Lowell Output from the GUI 1stoutput: Growth curve fitting results (with plot) and parameters; with cell density estimated for one future time point University of Massachusetts Lowell Johns Hopkins University Johns Hopkins University University of Delaware University of Maryland University of Delaware Clemson University Clemson University measurement is provided for the given time points, as well as levels predicted for a future time point 2ndoutput: As many as 12 amino acid levels predicted (with plot) if no Confidential
University of Massachusetts Lowell Output from the GUI 3rdoutput: A new Excel file containing previous inputs as well as predictions of future time points; this file can be used as input for next time point prediction University of Massachusetts Lowell Johns Hopkins University Johns Hopkins University University of Delaware University of Maryland University of Delaware Clemson University Clemson University Confidential
University of Massachusetts Lowell Output from the GUI University of Massachusetts Lowell Johns Hopkins University Johns Hopkins University University of Delaware University of Maryland University of Delaware Clemson University Clemson University cell culture (i.e. bioreactors in CHO bioprocesses) These outputs can be used as an estimation of future states in the CHO Future states can be used as guidance to design process control strategies Confidential
University of Massachusetts Lowell University of Massachusetts Lowell Johns Hopkins University Johns Hopkins University University of Delaware University of Maryland University of Delaware Clemson University Clemson University Media Optimization and Clone Analysis Tools Seongkyu Yoon University of Massachusetts Lowell Confidential
Introduction University of Massachusetts Lowell University of Massachusetts Lowell Johns Hopkins University Johns Hopkins University Objective for this tool: Suggest target nutrients for optimizing culture media for CHO cells based on genome-scale model predictions of maximal growth rate/protein productivity Suggest key metabolic pathways which affect the maximal growth/productivity as targets for cell line engineering University of Delaware University of Maryland University of Delaware Clemson University Clemson University Used Software and Algorithms: 1. Stand-alone .exe version created using MATLAB 2. COBRA Toolbox (https://opencobra.github.io/cobratoolbox/latest/index.html#), under GNU General Public License version 3.0 Confidential
University of Massachusetts Lowell Experiments required for GUI Cell culture experiments University of Massachusetts Lowell Johns Hopkins University Johns Hopkins University University of Delaware University of Delaware University of Maryland Clemson University Clemson University To calculate the specific consumption/production rates used as model constraints (model inputs) Confidential
Experiments required for GUI Data collection template (mg/mL, mmol/L) University of Massachusetts Lowell University of Massachusetts Lowell Johns Hopkins University Johns Hopkins University D0 D1 D2 D3 D14 Basal media Feed media University of Delaware University of Delaware University of Maryland Glucose Clemson University Clemson University Glutamate NH4 lactate Alanine Serine Cell growth IgG Specific rates template (mmol/gDW hr) Batch1 Batch 2 Batch 3 Specific rates calculation Equations Glucose Glutamate NH4 lactate Alanine GUI (MATLAB) Serine Cell growth Confidential IgG
University of Massachusetts Lowell GUI Johns Hopkins University Media optimization University of Delaware University of Maryland Cell line analysis Clemson University Input: Measured metabolite fluxes + target gene to knockout Input: Measured metabolite fluxes + target nutrient to optimize Output: Expected max growth or productivity change Output: Expected max growth or productivity change Confidential
University of Massachusetts Lowell GUI - Media optimization Johns Hopkins University (mainly for feed media A Graphical User Interface (GUI) was made for media optimization University of Delaware Clemson University GUI window Network of Cell lines Specify constraint inputs Objective function Targeted nutrient to optimize Click 1 Run simulation Confidential
University of Massachusetts Lowell Media optimization GUI - examples Johns Hopkins University University of Delaware Clemson University His can be used for future design Optimize cell growth during exponential phase Pro can be used for future design Optimize IgG productivity during stationary phase Confidential
University of Massachusetts Lowell GUI Cell line analysis A Graphical User Interface (GUI) was made for clone analysis (mainly for gene knockout/knock in simulation Johns Hopkins University University of Delaware Clemson University Main GUI window Network of Cell lines Specify constraint inputs Click 3 Pathway selection (sub GUI) Click 2 Gene knockout Objective function Click 4 Run simulation Click 1 Confidential
University of Massachusetts Lowell Clone analysis GUI examples Johns Hopkins University Sub GUI window University of Delaware Clemson University Gene lists: Gene symbol Gene description Confidential
Clone analysis GUI - examples University of Massachusetts Lowell Johns Hopkins University University of Delaware Clemson University Knockout Gene: 100758414 Knockout Gene: 100764163 Confidential


")