NGM282 in NASH Phase 2: 3 mg vs 6 mg QD Randomised Trial
This Phase 2 clinical trial compares the efficacy of NGM282 (3 mg vs 6 mg) versus placebo in patients with NASH. The primary endpoint is a 5% reduction in liver fat content at 12 weeks. Randomisation was stratified by diabetes status, and stable Type 2 diabetes and lipid-lowering treatments were maintained. The study demonstrated significant reductions in liver fat content with NGM282 compared to placebo, with associated improvements in fibrosis biomarkers and lipid profiles. NGM282 showed promising results in the treatment of NASH.

Download Presentation

Please find below an Image/Link to download the presentation.
The content on the website is provided AS IS for your information and personal use only. It may not be sold, licensed, or shared on other websites without obtaining consent from the author.If you encounter any issues during the download, it is possible that the publisher has removed the file from their server.
You are allowed to download the files provided on this website for personal or commercial use, subject to the condition that they are used lawfully. All files are the property of their respective owners.
The content on the website is provided AS IS for your information and personal use only. It may not be sold, licensed, or shared on other websites without obtaining consent from the author.
E N D
Presentation Transcript
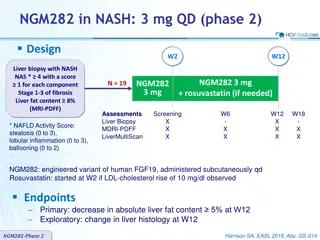
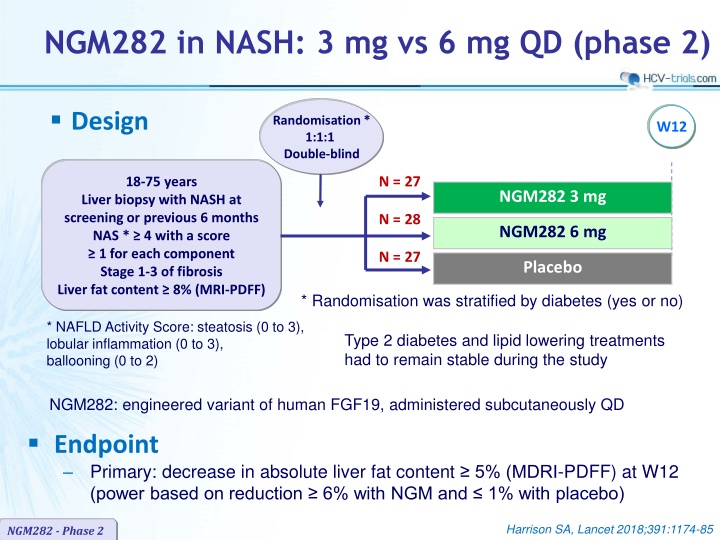
NGM282 in NASH: 3 mg vs 6 mg QD (phase 2) Design Randomisation* 1:1:1 Double-blind W12 N = 27 18-75 years NGM282 3 mg Liver biopsy with NASH at screening or previous 6 months NAS * 4 with a score 1 for each component Stage 1-3 of fibrosis Liver fat content 8% (MRI-PDFF) N = 28 NGM282 6 mg N = 27 Placebo * Randomisation was stratified by diabetes (yes or no) * NAFLD Activity Score: steatosis (0 to 3), lobular inflammation (0 to 3), ballooning (0 to 2) Type 2 diabetes and lipid lowering treatments had to remain stable during the study NGM282: engineered variant of human FGF19, administered subcutaneously QD Endpoint Primary: decrease in absolute liver fat content 5% (MDRI-PDFF) at W12 (power based on reduction 6% with NGM and 1% with placebo) Harrison SA, Lancet 2018;391:1174-85 NGM282 - Phase 2
NGM282 in NASH: 3 mg vs 6 mg QD (phase 2) Baseline characteristics and disposition NGM282 3 mg N = 27 NGM282 6 mg N = 28 Placebo N = 27 Mean age, years 52.0 56.4 52.8 Male, % 41 43 26 BMI, mean, kg/m2 34.0 34.7 35.6 Diabetes mellitus, % 56 61 63 HbA1c, mean, % 6.5 6.7 6.7 Hyperlipidemia / Hypertension, % 37 / 56 54 / 64 30 / 78 On statins / other antilipidaemic % 44 / 30 50 / 29 26 / 30 Fibrosis stage: F1 / F2 / F3, % 41 / 26 / 33 36 / 43 / 21 41 / 26 / 33 NAFLD activity score, mean 5.1 5.1 5.1 Liver fat content (MRDI-PDFF), mean, % 18.1 19.5 16.8 Pro-C3, mean, ng/mL 19.2 14.9 18.9 ELF score, mean Hyaluronic acid, mean, UG/L PIIINP, mean, UG/L TIMP-1, mean, UG/L 9.7 58.7 12.5 271.6 9.6 65.6 10.7 265.8 9.9 85.6 11.8 297.0 Discontinuation: AE / patient choice, N 3 / 0 3 / 1 0 / 2 Harrison SA, Lancet 2018;391:1174-85 NGM282 - Phase 2
NGM282 in NASH: 3 mg vs 6 mg QD (phase 2) Change in liver fat content (MRDI-PDFF) at W12 5% (treatment response) Absolute change Relative change Placebo (N = 27) NGM282 3 mg (N = 27) NGM282 6 mg (N = 28) % 0 0 100 -3 -10 -2 -0.9 79 74 80 -20 -4 -30 -6 60 -40 -8 40 -50 -10 -48 -9.7 -60 -12 p < 0.0001 20 -11.9 -60 p < 0.0001 7 -70 -14 p = 0.144 p = 0.112 -80 -16 0 p < 0.0001 p < 0.0001 Harrison SA, Lancet 2018;391:1174-85 NGM282 - Phase 2
NGM282 in NASH: 3 mg vs 6 mg QD (phase 2) Outcomes at W12 NGM282 3 mg N = 27 NGM282 6 mg N = 28 Placebo N = 27 30% in liver fat content (MDRI-PDFF) 85% * 86% * 7% ALT normalisation 37% ** 36% ** 4% C4, mean change at W12, ng/mL - 48.5 * - 25.9 * 11.7 Mean change in fibrosis biomarkers at W12 Pro-C3, ng/mL > 15% in pro-C3 ELF score Hyaluronic acid, UG/L PIIINP, UG/L TIMP-1, UG/L - 5.4 74% - 0.3 - 5.5 - 2.9 - 25.9 - 3.6 *** 76% - 0.1 22.6 - 1.5 - 18.0 - 1.21 24% 0 7.0 0 5.2 Mean change in lipids at W12, mmol/L Triglycerides Total cholesterol HDL-cholesterol LDL-cholesterol - 0.4 1.1 * 0 1.2 * - 0.5 0.8 0 1.0 * - 0.1 0 0 0 Hb A1c, mean change at W12, % HOMA-IR, mean change at W12 BMI, mean change at W12, kg/m2 - 0.2 - 0.9 - 0.4 - 0.2 0.7 - 0.9 - 0.1 1.13 - 0.2 C4 : 7 -hydroxy-4-cholesten-3-one vs placebo : *p < 0.0001 ; **p = 0.005 ; ***p = 0.034 ; p = 0.0005 ; p = 0.0002 ; p = 0.0047 ; p = 0.012 ; p = 0.024 NGM282 - Phase 2 p = 0.006 ; p = 0.021 ; Harrison SA, Lancet 2018;391:1174-85
NGM282 in NASH: 3 mg vs 6 mg QD (phase 2) Most common adverse events NGM282 3 mg N = 27 NGM282 6 mg N = 28 Placebo N = 27 Adverse event in > 10% in either group Injection site reactions Diarrhoea Abdominal pain Nausea Headache Abdominal distension Vomiting Frequent bowel movements Increased appetite Constipation Injection site brushing Weight decreased 11 (41%) 11 (41%) 8 (30%) 9 (33%) 3 (11%) 3 (11%) 2 (7%) 3 (11%) 2 (7%) 3 (11%) 2 (7%) 0 15 (54%) 10 (36%) 5 (18%) 4 (14%) 5 (18%) 4 (14%) 5 (18%) 1 (4%) 4 (14%) 1 (4%) 0 3 (11%) 2 (7%) 6 (22%) 2 (7%) 1 (4%) 5 (19%) 1 (4%) 0 2 (7%) 0 1 (4%) 3 (11%) 0 Serious adverse event 1 (4%) * 0 0 Discontinuation / transient interruption for AE, N 3 / 2 3 / 6 0 / 1 Treatment-related adverse events by severity Grade 1 Grade 2 Grade 3 Grade 4 18 (67%) 11 (41%) 2 (7%) ** 0 23 (82%) 12 (43%) 2 (7%) *** 0 14 (52%) 4 (15%) 1 (4%) 0 * Acute pancreatitis ; ** Aggravated abdominal pain, acute pancreatitis ; *** Nausea or abdominal pain, depression NGM282 - Phase 2 Harrison SA, Lancet 2018;391:1174-85
NGM282 in NASH: 3 mg vs 6 mg QD (phase 2) Summary In patients with NASH, 3 mg and 6 mg doses of NGM282 significantly and rapidly (over 12 weeks) reduced liver fat content, as measured by MRI-proton density fat fraction as well as markers of liver inflammation (ALT, AST) and fibrosis, as assessed by non-invasive biomarkers (pro-C3, enhanced liver fibrosis score) Significant decreases in serum C4 concentrations, and the ensuing increases in LDL-C were recorded with NGM282, consistent with potent target engagement and inhibition of CYP7A1 Both doses were generally well tolerated In view of the similar efficacy of NGM282 3 mg and 6 mg in lowering liver fat content, doses lower than 3 mg should be evaluated to better characterise the efficacy and tolerability profile Harrison SA, Lancet 2018;391:1174-85 NGM282 - Phase 2
")
")
")
")
")
")