Minimum Dietary Diversity for Women and Children
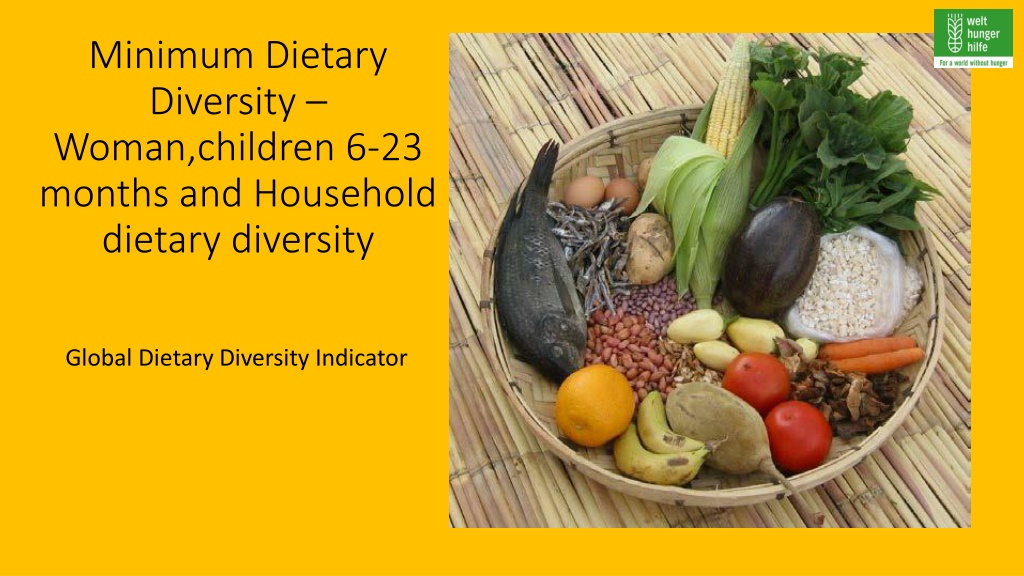

Minimum Dietary
Diversity –
Woman,children 6-23
months and Household
dietary diversity
Global Dietary Diversity Indicator


The FAO and FANTA convened a consensus meeting in July 2014 to select
a proxy indicator for Global use in assessing micro nutrient adequacy of
women’s diet
Indicators for assessing the Infant and young child
feeding practices – part 3
WHO, Unicef, IFPRI,FANTA, USAID, AED, UCDAVIS

Minimum Dietary Diversity –Woman is based on a
calculation based on 10 point food group score.
Women consuming foods from five or more
groups have a greater likelihood of meeting
their micro nutrient needs than women
consuming foods from fewer groups
Minimum Dietary Diversity –Women score
calculation
Percentage women receiving Minimum Dietary Diversity
Women 15-45 years of age who received foods from ≥ 5 food groups during the previous day
X 100
Total number of women interviewed
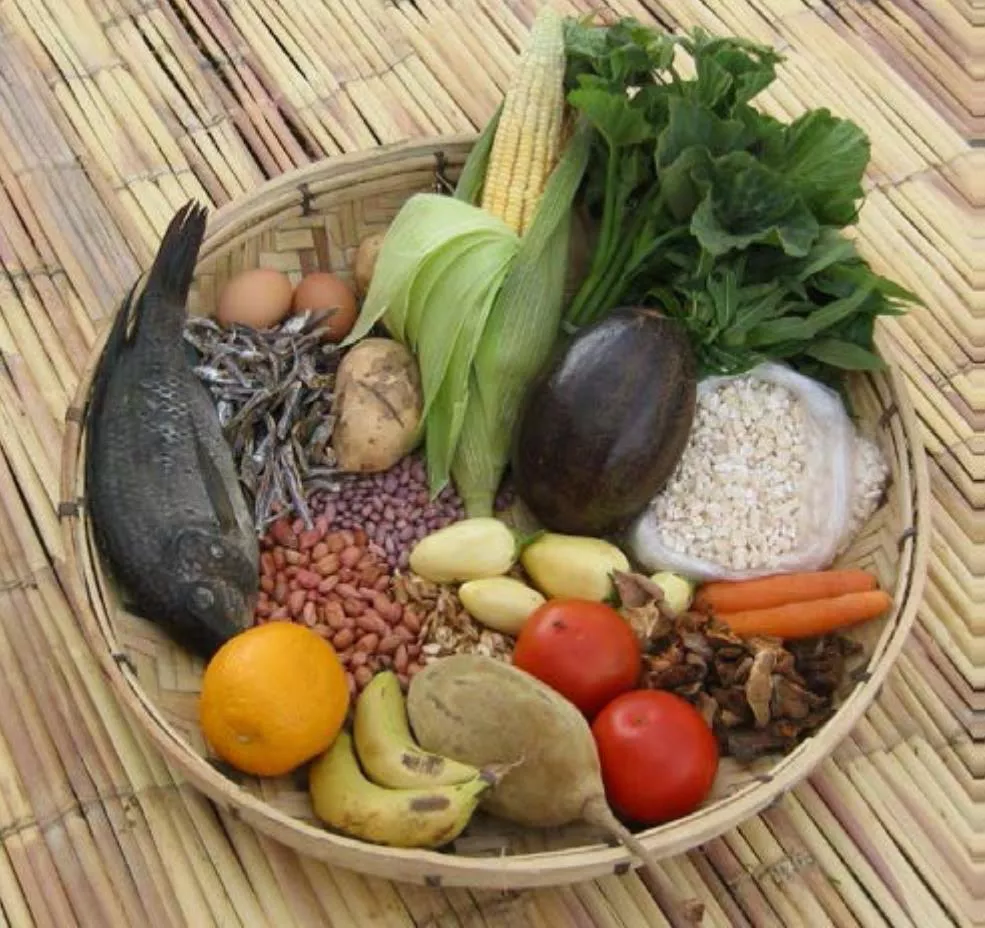
Minimum Dietary Diversity –Woman Food groups
Minimum Dietary Diversity –Woman is percentage of
women consuming at least 5 food groups out of 10 groups
Data collection on the basis of 24-
hour recall
Indicators are strongest when
consumption of trivial amounts
(<10g) of a food did not count in
Dietary Diversity score.
Response is collected from the target
sample : Women 15 – 49 years of age
Minimum Dietary diversity Children 6m to 23
months
•
Proportion of children who receive at least 4 food groups out of 7
groups
Children 6–23 months of age who received foods from ≥ 4 food groups during the previous day
Children 6–23 months of age
•
Sample universe for this indicator is the last born child 6-23 months
of age living with mother
7 food groups
Household Dietary diversity
HH who received foods from ≥ 6 food groups during the previous day
X 100
Total number of HH interviewed
•
HDDS=≤3 groups–
low
, 4-5 groups –
medium
, ≥6 groups
high
Minimum Dietary Diversity –Woman; Data collection format
Methodology
Data collection on the basis of 24 hour recall
Indicators are strongest when consumption of trivial amounts (<10g) of
a food did not count in Dietary Diversity score.
Response is collected from the target sample : Women 15 – 49 years of
age OR 6m -23m children
All locally available food in each group has to be listed prior to the
survey
There will be seasonal variation of food so appropriate listing needs to
be done
MDD -W OR MDD- child cannot be done around festivals or special days.
An individual may have a different score during the lean periods
Survey may be segregated into intervention area & nonintervention
area.
Visit local shops to assess consumption of fortified food- Salt
Food consumed by 50% of the family will not be considered in HH DDS
Sample size and timeline
Target families OR
All Households OR
Random selection of families(10%)
At least thrice a year (seasonal)
Explore the concept of Minimum Dietary Diversity for women and children aged 6-23 months, focusing on food group scores, indicator calculations, and the importance of consuming foods from various groups to meet nutrient needs. Learn about the key food groups, data collection methods, and the significance of maintaining a diverse diet for optimal health outcomes.

Download Presentation

Please find below an Image/Link to download the presentation.
The content on the website is provided AS IS for your information and personal use only. It may not be sold, licensed, or shared on other websites without obtaining consent from the author.If you encounter any issues during the download, it is possible that the publisher has removed the file from their server.
You are allowed to download the files provided on this website for personal or commercial use, subject to the condition that they are used lawfully. All files are the property of their respective owners.
The content on the website is provided AS IS for your information and personal use only. It may not be sold, licensed, or shared on other websites without obtaining consent from the author.
E N D
Presentation Transcript
Minimum Dietary Diversity Woman,children 6-23 months and Household dietary diversity Global Dietary Diversity Indicator
The FAO and FANTA convened a consensus meeting in July 2014 to select a proxy indicator for Global use in assessing micro nutrient adequacy of women s diet Indicators for assessing the Infant and young child feeding practices part 3 WHO, Unicef, IFPRI,FANTA, USAID, AED, UCDAVIS
Minimum Dietary Diversity Woman is based on a calculation based on 10 point food group score. Women consuming foods from five or more groups have a greater likelihood of meeting their micro nutrient needs than women consuming foods from fewer groups
Minimum Dietary Diversity Women score calculation Percentage women receiving Minimum Dietary Diversity Women 15-45 years of age who received foods from 5 food groups during the previous day X 100 Total number of women interviewed
Minimum Dietary Diversity Woman Food groups Sl Food groups 1 All starchy staples 2 Beans & Peas 3 Nuts & seeds 4 Dairy 5 Flesh foods 6 Eggs 7 Vitamin A rich dark green leafy vegetables 8 Other Vitamin A rich vegetables and fruits 9 Other vegetables 10 Other fruits
Minimum Dietary Diversity Woman is percentage of women consuming at least 5 food groups out of 10 groups Data collection on the basis of 24- hour recall Indicators are strongest when consumption of trivial amounts (<10g) of a food did not count in Dietary Diversity score. Response is collected from the target sample : Women 15 49 years of age
Minimum Dietary diversity Children 6m to 23 months Proportion of children who receive at least 4 food groups out of 7 groups Children 6 23 months of age who received foods from 4 food groups during the previous day Children 6 23 months of age Sample universe for this indicator is the last born child 6-23 months of age living with mother
7 food groups 1 2 3 4 5 6 7 Grains, Roots Tubers Legumes , Nuts Dairy products (milk, yogurt, Cheese) Flesh food ( meat, fish, Poultry, liver /organ) Eggs Vitamin A rich fruits & vegetables Other fruits and vegetables
Household Dietary diversity HH who received foods from 6 food groups during the previous day X 100 Total number of HH interviewed HDDS= 3 groups low, 4-5 groups medium, 6 groups high
Minimum Dietary Diversity Woman; Data collection format Yes-1 No-0 sl Food groups Examples Source 1 Cereals 2 White roots, tubers 3 Vitamin A rich vegetables and tubers 4 Other vegetables 5 Vitamin A rich fruits 6 7 8 9 11 Other fruits Organ meat Flesh meat Egg Fish & Sea food 12A Beans & peas nuts & seeds 12B 13 Milk & milk products 14 15 Oil & Fats Sweets 16 Spice, condiments & beverages Indicator for source of food Produced-1, market -2, Borrowed -3, donated -4, Other - 5, collected - 6
Methodology Data collection on the basis of 24 hour recall Indicators are strongest when consumption of trivial amounts (<10g) of a food did not count in Dietary Diversity score. Response is collected from the target sample : Women 15 49 years of age OR 6m -23m children All locally available food in each group has to be listed prior to the survey There will be seasonal variation of food so appropriate listing needs to be done MDD -W OR MDD- child cannot be done around festivals or special days. An individual may have a different score during the lean periods Survey may be segregated into intervention area & nonintervention area. Visit local shops to assess consumption of fortified food- Salt Food consumed by 50% of the family will not be considered in HH DDS
Sample size and timeline Target families OR All Households OR Random selection of families(10%) At least thrice a year (seasonal)