MESA LUNG III & NON-SMOKERS
The MESA Lung III & Non-Smokers Study provides detailed insights into lung health through measures like spirometry and chest CT scans. The study tracks completion rates and quality metrics, offering valuable information on post-bronchodilator spirometry and contrast CT imaging. Take a deep dive into the key measures and completion statuses to better understand the impact on respiratory health.
Download Presentation

Please find below an Image/Link to download the presentation.
The content on the website is provided AS IS for your information and personal use only. It may not be sold, licensed, or shared on other websites without obtaining consent from the author.If you encounter any issues during the download, it is possible that the publisher has removed the file from their server.
You are allowed to download the files provided on this website for personal or commercial use, subject to the condition that they are used lawfully. All files are the property of their respective owners.
The content on the website is provided AS IS for your information and personal use only. It may not be sold, licensed, or shared on other websites without obtaining consent from the author.
E N D
Presentation Transcript
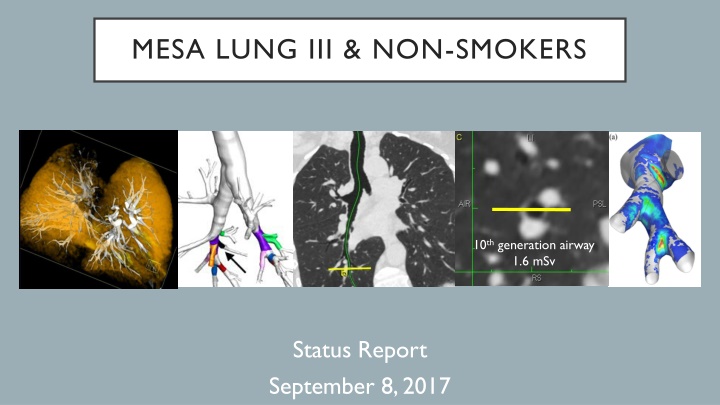
MESA LUNG III & NON-SMOKERS 10th generation airway 1.6 mSv Status Report September 8, 2017
MESA LUNG III & NON-SMOKER MEASURES KEY MEASURES Lung questionnaire Post-bronchodilator spirometry Non-contrast and contrast chest CT EXAM 6 TARGET 2,650
SPIROMETRY COMPLETION Pre-BD spirometry Post-BD spirometry Post-BD Spirometry Completed % 64.0 74.2 72.0 32.7 40.4 48.9 54.5 Lung Selected Consented Exam 6 visits to 9/6/2017 Questionnaire Completed % 98.5 100.0 100.0 100.0 100.0 99.2 99.7 Site Spirometry % 90.9 89.0 93.3 97.4 92.4 92.1 92.8 Spirometry % Completed % Selected % 99.2 86.7 95.2 92.0 98.2 97.5 98.6 95.0 96.7 85.7 98.3 91.5 97.7 91.5 3: WFU 4: CU 5: JHU 6: UMN 7: NWU 8: UCLA Total QUALITY 264 353 360 497 527 442 2443 25.5 35.1 32.6 22.4 25.4 25.3 27.2 DATA TRANSFER REPORTING Exam 6 Spirometry completed received at CCnot received at Spirometry Spirometry 25th %ile Median days 75th %ile Site Site CC 17 14 13 66 21 110 241 Last month by site 3: WFU 4: CU 5: JHU 6: UMN 7: NWU 8: UCLA Total 196 265 307 438 389 356 1951 179 251 294 372 368 246 1710 3: WFU 4: CU 5: JHU 6: UMN 7: NWU 8: UCLA All Sites 41 47 40 48 46 61 46 54 57 50 56 57 71 56 67 71 63 68 72 92 69 Week
CT COMPLETION Exam 6 visits to 9/6/2017 264 353 360 497 527 442 2443 Any CT Selected 90.9 89.0 93.3 97.4 92.4 92.1 92.8 Any CT Consented 98.3 92.0 93.8 95.9 75.2 97.1 91.0 Any CT Completed 41.1 82.4 97.8 93.3 83.9 29.4 72.6 Contrast CT Selected 53.8 63.2 66.9 35.2 73.6 72.6 61.0 Contrast CT Consented 88.7 63.7 64.7 82.3 54.1 84.1 70.3 Contrast CT Completed 34.8 72.0 90.6 95.2 89.8 19.1 59.8 Site 3: WU 4: CU 5: JHU 6: UMN 7: NWU 8: UCLA Total QUALITY DATA TRANSFER In Need attention 4 3 0 0 1 4 12 Preceding month 0% (0) 0% (0) 2.9% (2) 0% (0) Site Reviewed processPending 11 0 6 3 0 6 26 Protocol / QC issue Exam 6 Last month 3: WFU 4: CU 5: JHU 6: UMN 7: NWU 8: UCLA Total REPORTING Site All Sites 93 220 293 422 307 95 1430 0 5 0 4 0 2 11 High (above consent) High (below consent) Low QC Error 0.22% (3) 0.07% (1) 6.08% (82) 1.63% (22) 0.65% (1) 0% (0) 1.94% (3) 1.29% (2) High (above consent) Examples: Participant was scanned twice; other issues with the scan that resulted in radiation above 6.5mSv High (below consent) Examples: Participants who were not selected, but consented and completed scan; other issues with the scan, but radiation not above consented limit Low Level: Protocol deviation that influence radiation but total dose is below consented limit Examples: Scan starts more than 2cm above the apices or ends more than 5cm below the base of the lung QC Error: Violation is not protocol related Examples: scan clipping or motion resulting in unusable data; uncontrollable event resulting in unusable data. 25th %ile Median days 53 75th %ile 152 73
TAKE-HOME POINTS Lung questionnaire Spirometry quality CT consents Reporting Post-bronchodilator spirometry completion Contrast CT completion
