Mathematics vs. Statistics: Exploring the Differences and Challenges
Delve into the intriguing world of Mathematics and Statistics, understanding the distinctions between the two fields and the unique challenges top students face when transitioning between them. Explore the essence of mathematical and statistical thinking through insightful reflections and perspectives, shedding light on the contrasting nature of these disciplines.
Download Presentation

Please find below an Image/Link to download the presentation.
The content on the website is provided AS IS for your information and personal use only. It may not be sold, licensed, or shared on other websites without obtaining consent from the author.If you encounter any issues during the download, it is possible that the publisher has removed the file from their server.
You are allowed to download the files provided on this website for personal or commercial use, subject to the condition that they are used lawfully. All files are the property of their respective owners.
The content on the website is provided AS IS for your information and personal use only. It may not be sold, licensed, or shared on other websites without obtaining consent from the author.
E N D
Presentation Transcript
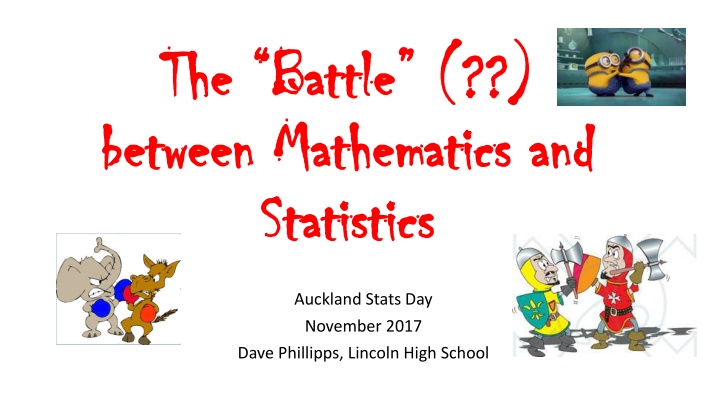
The Battle (??) The Battle (??) between Mathematics and between Mathematics and Statistics Statistics Auckland Stats Day November 2017 Dave Phillipps, Lincoln High School
Top 5!!! What are your top 5 reasons for loving Mathematics? What are your top 5 reasons for loving Statistics? Right to Challenge!
My Dilemma Why do we see top Mathematics students not performing well in Statistics standards?
What is Mathematics? What is Statistics? What is Mathematics? What is Statistics? Mathematics is the exploration and use of patterns and relationships in quantities, space, and time. Statistics is the exploration and use of patterns and relationships in data. These two disciplines are related but different ways of thinking and of solving problems. Both equip students with effective means for investigating, interpreting, explaining, and making sense of the world in which they live. Mathematics and statistics learning area title.
What is Mathematics? What is Statistics? What is Mathematics? What is Statistics? What is Mathematics to you? What is Statistics to you? What defines a Mathematical thinker? What defines a Statistical thinker?
Student thoughts Student thoughts high achiever in both high achiever in both Mathematics is puzzling you play around and get excited when a neat solution falls out; Statistics is the real world I ve gotten really good at debating!
Student thoughts Student thoughts Mathematics is introverted; Statistics is extroverted Mathematics is reliable; Statistics is ever-changing
So, are we one or So, are we one or the other the other a a Mathematical Mathematical thinker or a thinker or a Statistical thinker? Statistical thinker?
So what were the issues for our top So what were the issues for our top Mathematics students when doing Statistics? Mathematics students when doing Statistics? I took MAC201 so I didn t have to do any more Statistics didn t have to do all that writing stuff! Being too literal, too structured SUSSO/WECAR There was an inability to marry statistical thinking with contextual knowledge
So why do we have these issues? So why do we have these issues? The battle doesn t necessarily start with the students it can start within our curriculum departments!
What is the solution? What is the solution? Specialise: Teach in semesters with specialist Stats teachers teaching the stats units and Maths teachers the Maths units (??! Not an ideal solution) Teach the teachers first we need to shift any linear/structured approaches to teaching Statistical units to one of Statistical thinking (Growth Mindset) Grow depth in statistical thinking from Year 9 onwards
How do Statistics teachers teach Statistics? How do Statistics teachers teach Statistics? What do we do to model good Statistical What do we do to model good Statistical thinking? thinking? Eg.
Planning a survival guide for next years Yr9s Planning a survival guide for next years Yr9s Milestone ideas: 1) Plan a survey to gather information about what others think/believe new Year 9 s need to know a) best places around the school to be aware of as a new Year 9 b) what life at school might like (ie how to survive) in the: first day; first week; first term 2) Collect your data and analyse it using suitable graphs 3) Plan what information you are going to try and pass on to the 2018 Year 9 s for each of the three parts in your Digital Presentation 4) Plan what information is needed in your Treasure Map, including directions and distances from a key starting point. 5) Complete your Treasure Map 6) Complete your Survival Guide 7) Present your Survival Guide How do we run this to develop Statistical Thinking?
Your thoughts? Dave Phillipps: dph@lincoln.school.nz
