Materials Sector Analysis Overview
This analysis delves into the performance, trends, and external factors affecting the Materials Sector, focusing on S&P 500 comparison, industry overview, business analysis, business cycle, and external impacts like COVID-19 and supply chain disruptions
Download Presentation

Please find below an Image/Link to download the presentation.
The content on the website is provided AS IS for your information and personal use only. It may not be sold, licensed, or shared on other websites without obtaining consent from the author.If you encounter any issues during the download, it is possible that the publisher has removed the file from their server.
You are allowed to download the files provided on this website for personal or commercial use, subject to the condition that they are used lawfully. All files are the property of their respective owners.
The content on the website is provided AS IS for your information and personal use only. It may not be sold, licensed, or shared on other websites without obtaining consent from the author.
E N D
Presentation Transcript
Materials Sector Analysis Ally Hornstein, Xuejing Huang, Stephen Hill Autumn 2021
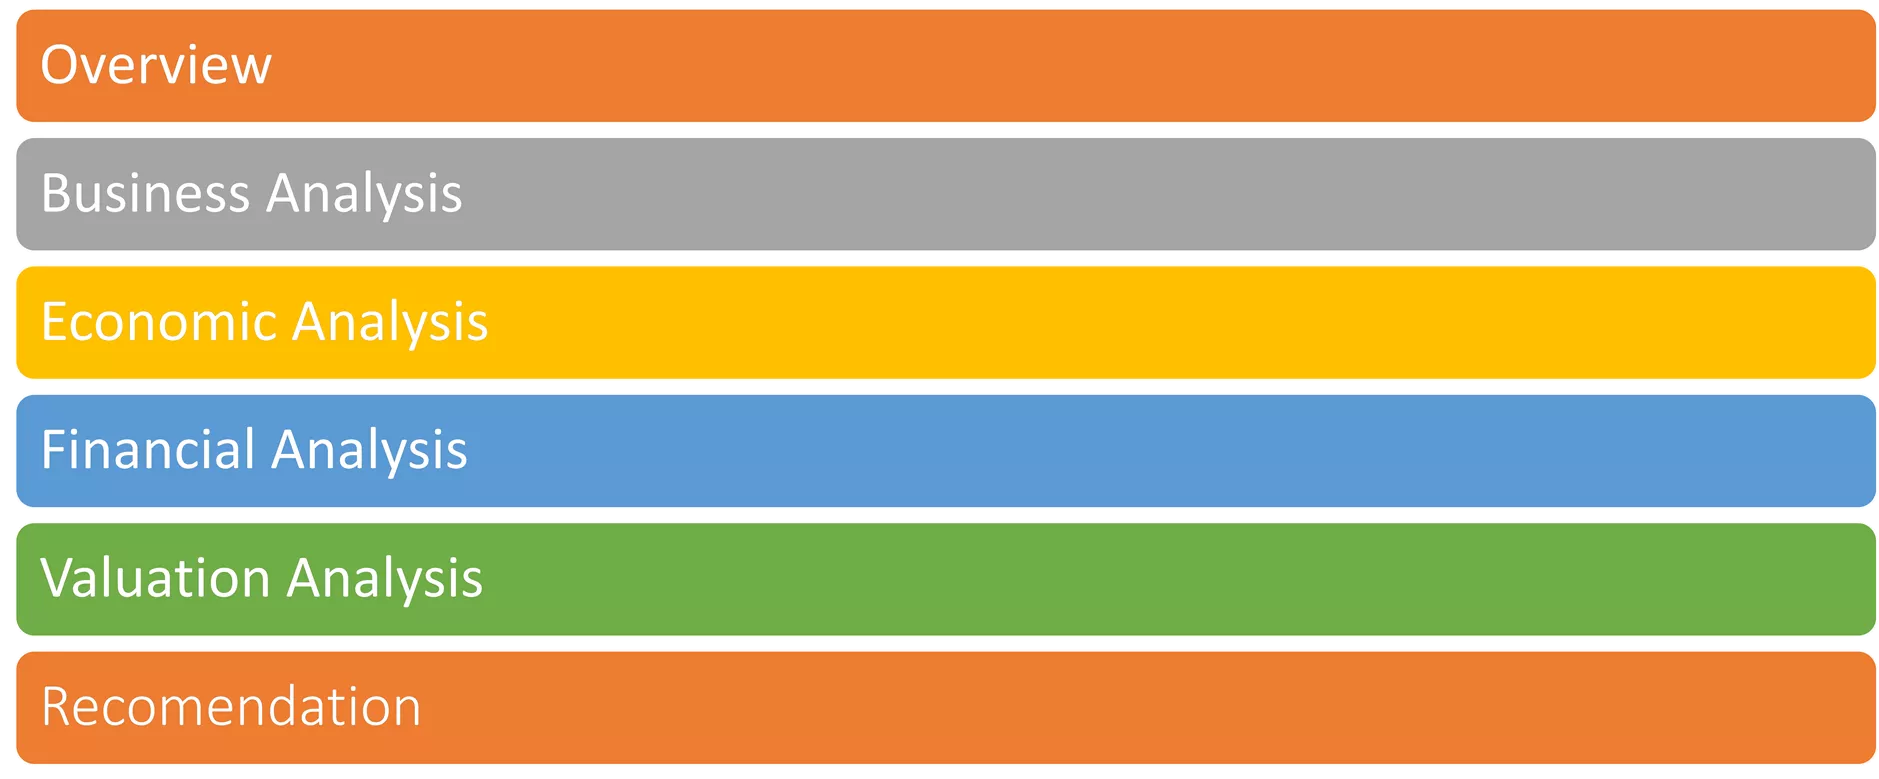
Materials Agenda Overview Business Analysis Economic Analysis Financial Analysis Valuation Analysis Recomendation
S&P 500 vs. SIM The Materials Sector Represents 2.49% of the S&P 500 Current SIM holding is 3.28% of total (overweight) Material Sector: 3.28% Material Sector: 2.49%
Material Companies in S&P500 Material Companies in S&P500
Sector Performance YTD Materials Sector Performance Vs. S&P 500 YTD Materials Sector Performance Vs. S&P 500 The Materials Sector has outperformed the S&P 500 this year Materials S&P500
Business Cycle Materials sector is HIGHLY cyclical Currently in the early stage Demand to rebound as economy begins to recover Source: Fidelity.com
External Factors External Factors CPI COVID-19 Economy Unemployment Interest Rates Supply Chain
External Factors External Factors Due to COVID-19, the materials sector has been hard hit with supply chain issues One interesting sub sector of the Metals & Mining Industry to evaluate is the Steel Industry "At one point, steel prices were 300% above their pre-pandemic levels at more than $1,900 per ton. Before the pandemic, steel priced between $500 per ton and $800 per ton." (CNBC) This has led several analysts to question if we are currently in a steel market bubble Source: https://www.cnbc.com/2021/10/07/how-a-us-steel-shortage-created-a-market-bubble.html
User & Geography User & Geography Industry Focus: Metals & Mining End Users Include: Energy Non-Energy (Pipe & Tube) Construction Automotive Manufacturing Markets Jewlery-Making
Supply and Demand Supply and Demand Supply for materials is in high demand, but supply chain issues has created a shortage Materials is #1 reason for project disruptions
Supply and Demand Supply and Demand Industries such as Construction and Manufacturing effected the most from materials shortage Demand for materials at all time highs
Supply and Demand Supply and Demand
Poter's Five Forces Poter's Five Forces https://disruptivnation.com/2019/11/17/porters-five-forces/
Threat of Entry Threat of Entry Threat of Entry: Low The Materials Sector Requires: Large Capital Needs Quality products, that require the greatest efficiency and effectiveness as possible Government Regulations Patents Large Human Capital Expensive Technology https://graduateway.com/chemical-industry-analysis-using-porters-five-force-model/
Supplier Power Supplier Power Supplier Power: Moderate Suppliers of goods such as lumber, steel, and stone have moderate power Suppliers of rare materials such as chemicals and precious minerals have significant power Due to the materials sector being broadly diversified, supplier power is mixed
Buyer Power Buyer Power Buyer Power: Low Buyer Power is generally low in the Materials Sector The government can step in and place price ceilings on raw materials if necessary Most materials companies sell directly to their user industries through their own distribution networks https://www.equitymaster.com/detail.asp?date=12/29/2008&story=4&title=Steel-Five-force-analysis
Threat of Substitution Threat of Substitution Threat of Substitution: Threat of Substitution: Low Difficult to substitute since many of these companies produce specialized materials Chemicals and minerals are not readily available to be replaced
Competitive Rivalry Competitive Rivalry Competitive Rivalry: Competitive Rivalry: Moderate to High Moderate Competition Metals & Mining High Competition Chemicals Containers & Packaging Construction Materials
Financial Analysis Sector & Industry
Financial Analysis Companies
Financial Analysis S&P500 vs. Materials: Profit Margin
Financial Analysis Future Profit Margins vs. Current
Valuation Analysis Sector & Industry Companies
Valuation Analysis Historical Analysis Materials Sector
Valuation Analysis Historical Analysis MOS
Valuation Analysis YTD Material Stocks Performance
Valuation Analysis vs. S&P 500 RATIO ANALYSIS TREND ANALYSIS P/E Forecasts significantly increased for 2020 A, but seem to be leveling out per analyst estimates COVID-19 This increase is apparent in the recent Valuation Analysis of MOS P/E S&P 500: 25.92 Materials Sector: 20.54 Undervalued: Current Materials P/E is lower than the S&P 500 P/E by 29.2% P/S, P/B, P/FCF have generally increased for the Materials Sector P/S Spotlight: S&P 500: 3.46 Materials Sector Stocks have generally reported substantial gains YTD Materials Sector: 2.83 Undervalued: Current Materials P/S is lower than the S&P 500 P/S by 10.2% Profit Margins, Return on Assets, and Return on Equity are worth notable mention as they have greatly increased P/B S&P 500: 4.77 Materials Sector: 3.26 Undervalued: Current Materials P/B is lower than the S&P 500 P/B by 33.6% P/FCF S&P 500: 16.99 Materials Sector: 12.31 Undervalued: Current Materials P/B is lower than the S&P 500 P/B by 27.5%
Recommendation Currently the SIM portfolio has materials weighted higher than the S&P500 (Overweight) Materials is second lowest weighted in the S&P500 while it's third lowest in the SIM portfolio
Recommendation Recommendation: Keep Position In the future, lower position to S&P500 Positives Future growth projections high for the sector Several industries and companies valued low compared to projected earnings Historically, materials sector does significantly well after a recession Risks Supply chains will prolong economic recovery Highly cyclical and dependent on US economy Future economic outlook is uncertain with Covid-19 causing disruptions


