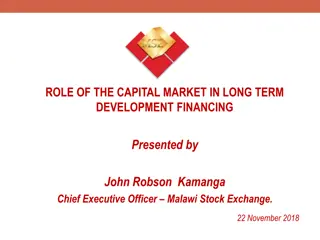
Market Performance and Development in 2019
Explore the market metrics, capital & NSI analysis, top gainers & losers, and market development initiatives in the Nigerian capital market throughout 2019. Discover challenges and upcoming tasks for enhancing market integrity and transparency.

Download Presentation

Please find below an Image/Link to download the presentation.
The content on the website is provided AS IS for your information and personal use only. It may not be sold, licensed, or shared on other websites without obtaining consent from the author. If you encounter any issues during the download, it is possible that the publisher has removed the file from their server.
You are allowed to download the files provided on this website for personal or commercial use, subject to the condition that they are used lawfully. All files are the property of their respective owners.
The content on the website is provided AS IS for your information and personal use only. It may not be sold, licensed, or shared on other websites without obtaining consent from the author.
E N D
Presentation Transcript
REPORT TO THE CAPITAL MARKET COMMITTEE Lagos, August 2019 1
NASD MARKET METRICS2019 Q2 Q1 Quarterly Market Performance Admitted Securities AGM s Held Total Issued Shares (bn units) Dematerialized (%) 38 10 38 2 Volume Value Deals 140.67 37.77 140.67 30.40 20000.00 1200 18000.00 1000 Equities Total Deals Volume Traded (bn units) Value Traded (bn) Average deal Value (mn) Bonds Total Deal Count Volume Traded(mm units) 16000.00 652 1.42 2.18 2.06 1046 1.15 5.11 19.79 14000.00 800 12000.00 10000.00 600 8000.00 Nil Nil 400 6000.00 Nil Nil 4000.00 Value Traded bn Nil Nil 200 2000.00 0.00 0 Q1 2017 Q2 2017 Q3 2017 Q4 2017 Q1 2018 Q2 2018 Q3 2018 Q4 2018 Q1 2019 Q2 2019 2
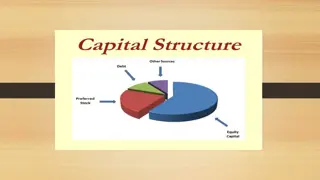
MARKET CAPAND NSI 2019 Q2 Q1 Market ( 'bn) Cap 536.20 544.39 Index 746.34 757.75 Change % -1.51 2.38 Market Cap USI 580.00 760.00 560.00 710.00 540.00 520.00 660.00 500.00 610.00 480.00 560.00 460.00 30-Jan-19 28-Feb-19 31-Mar-19 30-Apr-19 31-May-19 30-Jun-19 2019 TOP 5 PRICE GAINERS & LOSERS Gainers Open Jan ( ) Close Jun ( ) Change % Losers Open Jan ( ) Close Jun ( ) Change % 1 CSCS PLC 1 AG MORTAGE BANK PLC 12.00 14.88 +24.00 0.6 0.58 -3.33 2 NASD PLC 2.59 3.20 +23.55 2 NDEP PLC 308 294.42 -4.41 3 GEOFLUID PLC 0.49 0.53 +8.16 3 FCWAMCO PLC 164.55 155.92 -5.24 4 FOOD CONCEPT Plc 0.66 0.70 +6.06 4 MASSTCOM PLC 0.53 0.50 -5.66 5 AFRILAND PLC 2.25 2.37 +5.33
MARKET DEVELOPMENT 2019 NASDEP OTC MARKET Cultivating relationships across various sectors through partnerships Official Launch of NASD Data Portal Repository Development of API Data Feeds and Price Tickers Development of NASD-Alert system to notify investors of trade activities on their accounts NASD Mobile Application Expiration of Value Added Tax circulated to Market Participants Drafted guidelines on Negotiated deals and High-Volume Trade Food Concepts and Allianz Insurance Plc Rights Issues executed Visited 13 Participating Institution on NASD Surveillance Inspection program Forthcoming NASD Stakeholder engagement program to be held Visited numerous PLCS registered with SEC Observed 12 Annual General Meeting of NASD trading Securities with industry associations and trade groups e.g. Manufacturers Association of Nigeria (M.A.N). Partnerships with professional bodies in order to increase participation of advisers on the portal e.g. Institute of Chartered Accountants of Nigeria (ICAN). Collaborating with private equity investors, multilaterals and sovereign funds to deepen pool of investors available on the portal. Co-Hosted workshop on NASDeP for members of the Lagos Chamber of Commerce (LCCI).
CHALLENGES / NEXTTASKS Improving corporate compliance levels with Investment and Securities Act 2007 Registration of Public Securities with SEC Failure of public companies to render regular returns Limited financial information Company Secretaries running parallel OTC markets