Mapping QTL and Selection of Soybean Lines with High Essential Amino Acids
Soybean (Glycine max L.) plays a crucial role as a crop in North Carolina, especially for its essential amino acids content critical for human and animal nutrition. This study aims to identify quantitative trait loci (QTL) for essential amino acids in soybean seeds using a genetic map from the Forrest by Williams 82 recombinant inbred line (RIL) population. The correlation among essential amino acids and other quality traits in soybean seeds is also explored, with the goal of selecting elite lines with high amino acid contents. Preliminary data on the protein and oil distribution in the RIL population show potential for further genetic mapping and selection of improved soybean lines.
Download Presentation

Please find below an Image/Link to download the presentation.
The content on the website is provided AS IS for your information and personal use only. It may not be sold, licensed, or shared on other websites without obtaining consent from the author.If you encounter any issues during the download, it is possible that the publisher has removed the file from their server.
You are allowed to download the files provided on this website for personal or commercial use, subject to the condition that they are used lawfully. All files are the property of their respective owners.
The content on the website is provided AS IS for your information and personal use only. It may not be sold, licensed, or shared on other websites without obtaining consent from the author.
E N D
Presentation Transcript
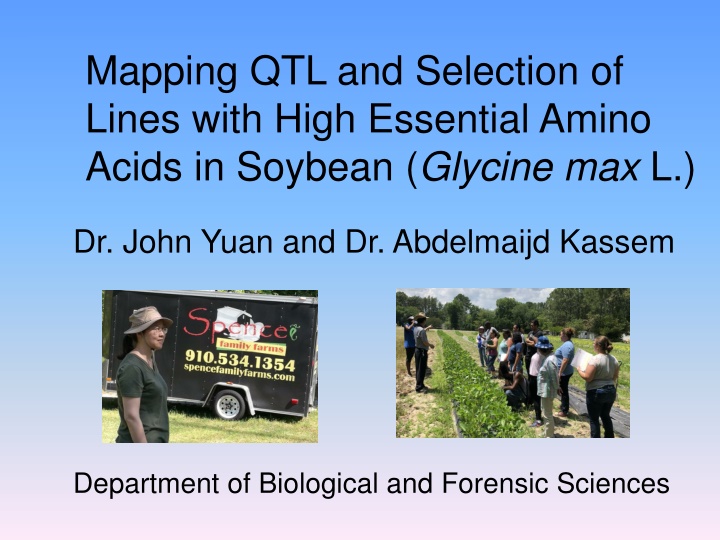
Mapping QTL and Selection of Lines with High Essential Amino Acids in Soybean (Glycine max L.) Dr. John Yuan and Dr. Abdelmaijd Kassem Department of Biological and Forensic Sciences
Soybean [Glycine max (L.) Merrill] is very important crop in North Carolina. Nine essential amino acids [Phenylalanine (Phe), Valine (Val), Threonine (Thr), Tryptophan (Trp), Methionine (Met), Leucine (Leu), Isoleucine (Ile), Lysine (Lys), and Histidine (His)] can t be de novo synthesized by human or animal cells and these amino acids must be obtained from diet. The objectives of this study are to define the quantitative trait loci (QTL) for essential amino acids contents in soybean seeds in Forrest by Williams 82 recombinant inbred line (RIL) population based on a high-resolution genetic map and thereby select elite lines with high essential amino acids contents for community.
Preliminary data Protein Oil 60 60 50 50 40 40 Frequency Frequency 30 30 20 20 10 10 0 0 18 20 22 24 40 42 44 46 48 Oil (%) Protein (%) Distribution of oil content in soybean seeds of FxW82 RIL population Distribution of protein content in soybean seeds of FxW82 RIL population
Correlation among essential amino acids and other quality traits in soybean seeds of FxW82 RIL population (2018, Spring Lake, NC) 1.80 2.10 0.58 0.70 . 2.4 3.2 1.9 2.4 0.38 0.46 21 25 42 Protein 0.44* 0.50** 0.55** 0.50** 0.41* 0.38* 0.55** -0.46** 0.34 -0.032 -0.045 36 2.10 Thr 0.87*** 0.83*** 0.49** 0.43* 0.41* -0.43* 0.25 0.077 -0.07 -0.10 1.80 2.7 Val 0.65*** 0.36* 0.42* 0.42* 0.23 0.23 0.15 -0.26 -0.28 2.3 0.70 Met 0.72*** 0.46** 0.74*** 0.37* -0.71*** -0.20 -0.27 0.19 0.58 2.1 Iso *** 0.46** -0.56*** -0.69*** 0.95 0.29 0.29 0.10 1.8 3.2 Leu 0.43* 0.50** -0.55** -0.60*** 0.23 0.16 2.4 1.9 Phe 0.86*** 0.70*** 0.56*** -0.77*** 0.11 1.5 One more year phenotypic data is needed to map QTL for essential amino acids and elite lines selection. Lys 0.40* 0.62*** 2.4 -0.67*** 0.087 1.9 0.6 1.2 His 0.47** -0.80*** 0.074 0.46 Trp -0.20 -0.28 0.38 40 Sucrose -0.54** 10 25 Oil 21 36 42 2.3 2.7 1.8 2.1 1.5 1.9 0.6 1.2 10 40
